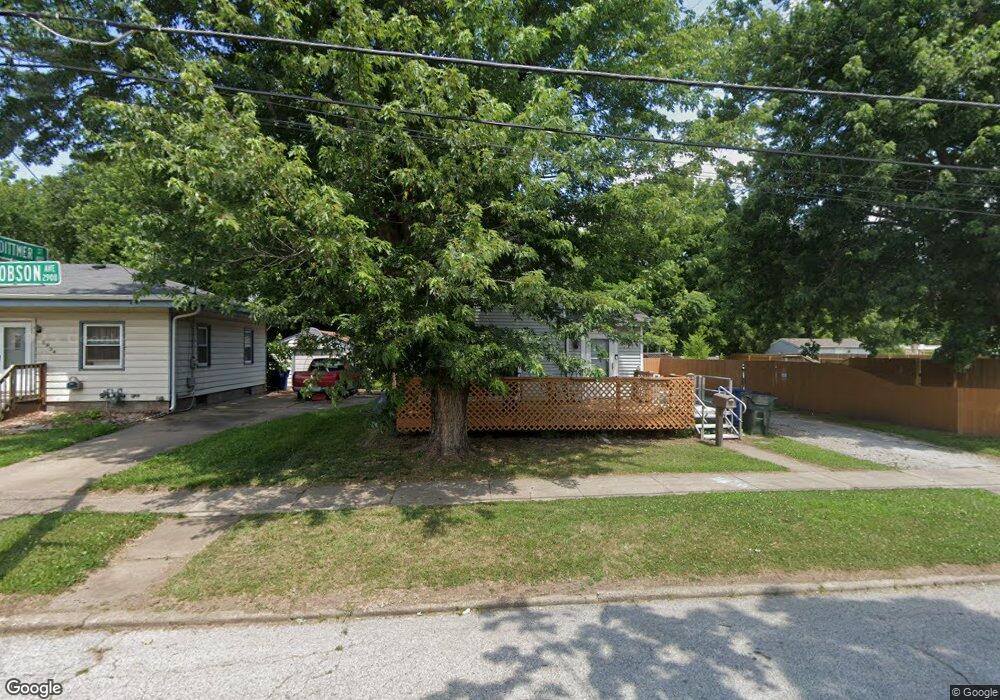
2928 Hobson Ave Davenport, IA 52802
West End NeighborhoodEstimated Value: $122,000 - $147,318
4
Beds
4
Baths
1,451
Sq Ft
$97/Sq Ft
Est. Value
About This Home
This home is located at 2928 Hobson Ave, Davenport, IA 52802 and is currently estimated at $140,080, approximately $96 per square foot. 2928 Hobson Ave is a home located in Scott County with nearby schools including Walnut Hill Elementary School, South Christian Elementary School, and Caverna Middle School.
Ownership History
Date
Name
Owned For
Owner Type
Purchase Details
Closed on
May 11, 2006
Sold by
Orris Kwilliam O and Orris Myrna M
Bought by
Fentress Ronnie D and Fentress Roshell
Current Estimated Value
Home Financials for this Owner
Home Financials are based on the most recent Mortgage that was taken out on this home.
Original Mortgage
$83,125
Outstanding Balance
$56,424
Interest Rate
9.85%
Mortgage Type
Adjustable Rate Mortgage/ARM
Estimated Equity
$83,656
Purchase Details
Closed on
Oct 5, 2005
Sold by
The Secretory Of Hud
Bought by
Orris William P and Orris Myrna M
Home Financials for this Owner
Home Financials are based on the most recent Mortgage that was taken out on this home.
Original Mortgage
$60,000
Interest Rate
5.88%
Mortgage Type
Future Advance Clause Open End Mortgage
Purchase Details
Closed on
Feb 28, 2005
Sold by
Washington Mutual Bank F A
Bought by
Secretary Of Hud
Purchase Details
Closed on
Feb 14, 2005
Sold by
Brown Michael and Brown Carol A
Bought by
Washington Mutual Bank Fa
Create a Home Valuation Report for This Property
The Home Valuation Report is an in-depth analysis detailing your home's value as well as a comparison with similar homes in the area
Home Values in the Area
Average Home Value in this Area
Purchase History
| Date | Buyer | Sale Price | Title Company |
|---|---|---|---|
| Fentress Ronnie D | $87,500 | None Available | |
| Orris William P | -- | None Available | |
| Secretary Of Hud | $89,500 | None Available | |
| Washington Mutual Bank Fa | $89,111 | None Available |
Source: Public Records
Mortgage History
| Date | Status | Borrower | Loan Amount |
|---|---|---|---|
| Open | Fentress Ronnie D | $83,125 | |
| Previous Owner | Orris William P | $60,000 |
Source: Public Records
Tax History Compared to Growth
Tax History
| Year | Tax Paid | Tax Assessment Tax Assessment Total Assessment is a certain percentage of the fair market value that is determined by local assessors to be the total taxable value of land and additions on the property. | Land | Improvement |
|---|---|---|---|---|
| 2025 | $815 | $143,080 | $30,300 | $112,780 |
| 2024 | $947 | $121,930 | $30,300 | $91,630 |
| 2023 | $1,219 | $121,930 | $30,300 | $91,630 |
| 2022 | $823 | $103,660 | $24,620 | $79,040 |
| 2021 | $1,921 | $99,190 | $24,620 | $74,570 |
| 2020 | $893 | $95,460 | $24,620 | $70,840 |
| 2019 | $784 | $91,730 | $24,620 | $67,110 |
| 2018 | $1,612 | $91,730 | $24,620 | $67,110 |
| 2017 | $510 | $91,730 | $24,620 | $67,110 |
| 2016 | $670 | $82,130 | $0 | $0 |
| 2015 | $1,654 | $88,110 | $0 | $0 |
| 2014 | $1,654 | $88,110 | $0 | $0 |
| 2013 | $1,654 | $0 | $0 | $0 |
| 2012 | -- | $90,900 | $22,550 | $68,350 |
Source: Public Records
Map
Nearby Homes
- 520 S Clark St
- 3011 Telegraph Rd
- 3154 Diehn Ave
- 2614 Mckinley Ave
- 2707 Jackson Ave
- 2639 Whitewood Ave
- 125 S Birchwood Ave
- 815 S Dittmer St
- 2736 Rockingham Rd
- 2537 Boies Ave
- 2502 Rockingham Rd
- 124 N Elmwood Ave
- 223 S Lincoln Ave
- 131 S Lincoln Ave
- 2312 W 1st St
- 2312 1/2 W 1st St
- 1109 S Michigan Ave
- 3207 Homestead Ave
- 120 N Pine St
- 2243 W 4th St
- 2920 Hobson Ave
- 2934 Hobson Ave
- 3004 Hobson Ave
- 2923 Indian Rd
- 2912 Hobson Ave
- 3008 Hobson Ave
- 403 S Dittmer St
- 2919 Hobson Ave
- 2919 Indian Rd
- 2917 Indian Rd
- 3014 Hobson Ave
- 404 S Dittmer St
- 402 S Clark St
- 3007 Indian Rd
- 413 S Dittmer St
- 410 S Dittmer St
- 406 S Clark St
- 3018 Hobson Ave
- 3011 Indian Rd
- 415 S Dittmer St