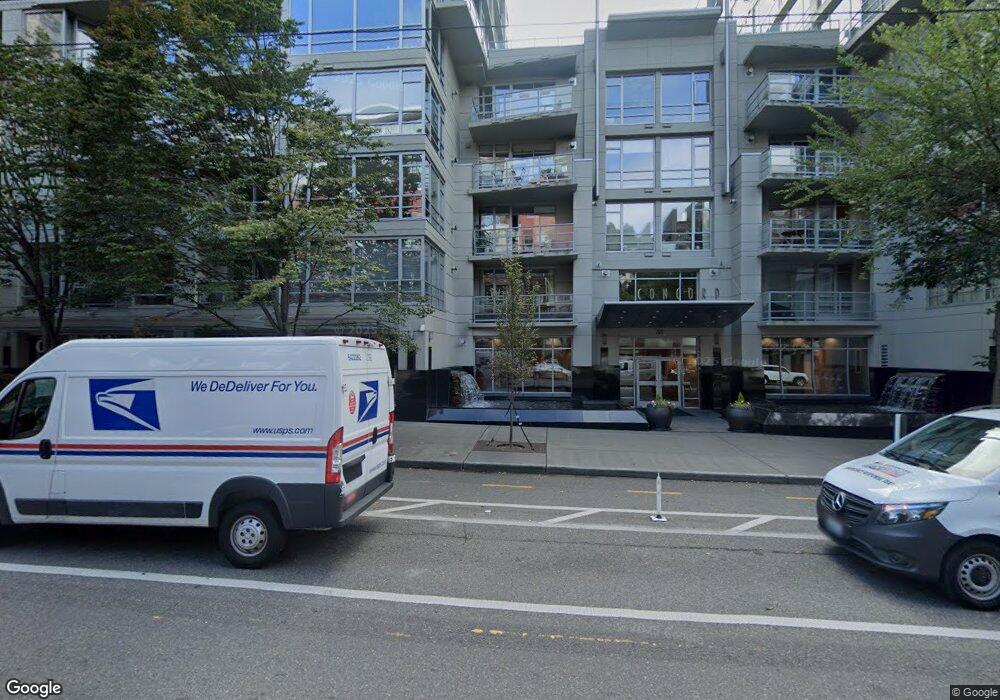
2929 1st Ave Unit N1004 Seattle, WA 98121
Belltown NeighborhoodEstimated Value: $399,106 - $436,000
1
Bed
1
Bath
597
Sq Ft
$704/Sq Ft
Est. Value
About This Home
This home is located at 2929 1st Ave Unit N1004, Seattle, WA 98121 and is currently estimated at $420,527, approximately $704 per square foot. 2929 1st Ave Unit N1004 is a home located in King County with nearby schools including Lowell Elementary School, Meany Middle School, and Garfield High School.
Ownership History
Date
Name
Owned For
Owner Type
Purchase Details
Closed on
Apr 12, 2007
Sold by
Smallwood Jeffrey N
Bought by
Leong Penny M
Current Estimated Value
Home Financials for this Owner
Home Financials are based on the most recent Mortgage that was taken out on this home.
Original Mortgage
$272,993
Outstanding Balance
$164,604
Interest Rate
6.1%
Estimated Equity
$255,923
Purchase Details
Closed on
Sep 8, 2005
Sold by
Drescher John C
Bought by
Smallwood Jeffrey N
Home Financials for this Owner
Home Financials are based on the most recent Mortgage that was taken out on this home.
Original Mortgage
$271,600
Interest Rate
5.25%
Purchase Details
Closed on
Dec 30, 1999
Sold by
Concord Llc
Bought by
Drescher John C
Home Financials for this Owner
Home Financials are based on the most recent Mortgage that was taken out on this home.
Original Mortgage
$171,992
Interest Rate
7.87%
Create a Home Valuation Report for This Property
The Home Valuation Report is an in-depth analysis detailing your home's value as well as a comparison with similar homes in the area
Home Values in the Area
Average Home Value in this Area
Purchase History
| Date | Buyer | Sale Price | Title Company |
|---|---|---|---|
| Leong Penny M | $389,990 | Chicago Title | |
| Smallwood Jeffrey N | $339,500 | Commonwealth L | |
| Drescher John C | $214,990 | Evergreen Title Company Inc |
Source: Public Records
Mortgage History
| Date | Status | Borrower | Loan Amount |
|---|---|---|---|
| Open | Leong Penny M | $272,993 | |
| Previous Owner | Smallwood Jeffrey N | $271,600 | |
| Previous Owner | Drescher John C | $171,992 |
Source: Public Records
Tax History Compared to Growth
Tax History
| Year | Tax Paid | Tax Assessment Tax Assessment Total Assessment is a certain percentage of the fair market value that is determined by local assessors to be the total taxable value of land and additions on the property. | Land | Improvement |
|---|---|---|---|---|
| 2024 | $3,660 | $393,000 | $54,200 | $338,800 |
| 2023 | $3,339 | $433,000 | $54,200 | $378,800 |
| 2022 | $3,554 | $406,000 | $45,800 | $360,200 |
| 2021 | $3,772 | $398,000 | $45,800 | $352,200 |
| 2020 | $4,679 | $401,000 | $45,800 | $355,200 |
| 2018 | $3,864 | $487,000 | $41,300 | $445,700 |
| 2017 | $3,302 | $401,000 | $37,500 | $363,500 |
| 2016 | $2,417 | $354,000 | $30,400 | $323,600 |
| 2015 | $2,808 | $252,000 | $26,700 | $225,300 |
| 2014 | -- | $300,000 | $23,300 | $276,700 |
| 2013 | -- | $260,000 | $22,100 | $237,900 |
Source: Public Records
Map
Nearby Homes
- 2929 1st Ave Unit N600
- 2929 1st Ave Unit N1104
- 2929 1st Ave Unit S319
- 2929 1st Ave Unit N205
- 2929 1st Ave Unit S721
- 2929 1st Ave Unit N309
- 2929 1st Ave Unit S1217
- 2929 1st Ave Unit S720
- 2929 1st Ave Unit S718
- 2911 2nd Ave Unit 313
- 2911 2nd Ave Unit 310
- 2911 2nd Ave Unit 1003
- 2911 2nd Ave Unit 1117
- 2911 2nd Ave Unit 120
- 2911 2nd Ave Unit 411
- 2911 2nd Ave Unit 610
- 2801 1st Ave Unit 612
- 2801 1st Ave Unit 113
- 2801 1st Ave Unit 807
- 2801 1st Ave Unit 215
- 2929 1st Ave Unit PH6
- 2929 1st Ave Unit B
- 2929 1st Ave
- 2929 1st Ave Unit 304
- 2929 1st Ave
- 2929 1st Ave Unit PH3
- 2929 1st Ave Unit PH-5
- 2929 1st Ave Unit N1103
- 2929 1st Ave Unit N1105
- 2929 1st Ave Unit N310
- 2929 1st Ave Unit N305
- 2929 1st Ave Unit N303
- 2929 1st Ave Unit N1003
- 2929 1st Ave Unit N1005
- 2929 1st Ave Unit N707
- 2929 1st Ave Unit N801
- 2929 1st Ave Unit S522
- 2929 1st Ave Unit S322
- 2929 1st Ave Unit N504
- 2929 1st Ave Unit N705