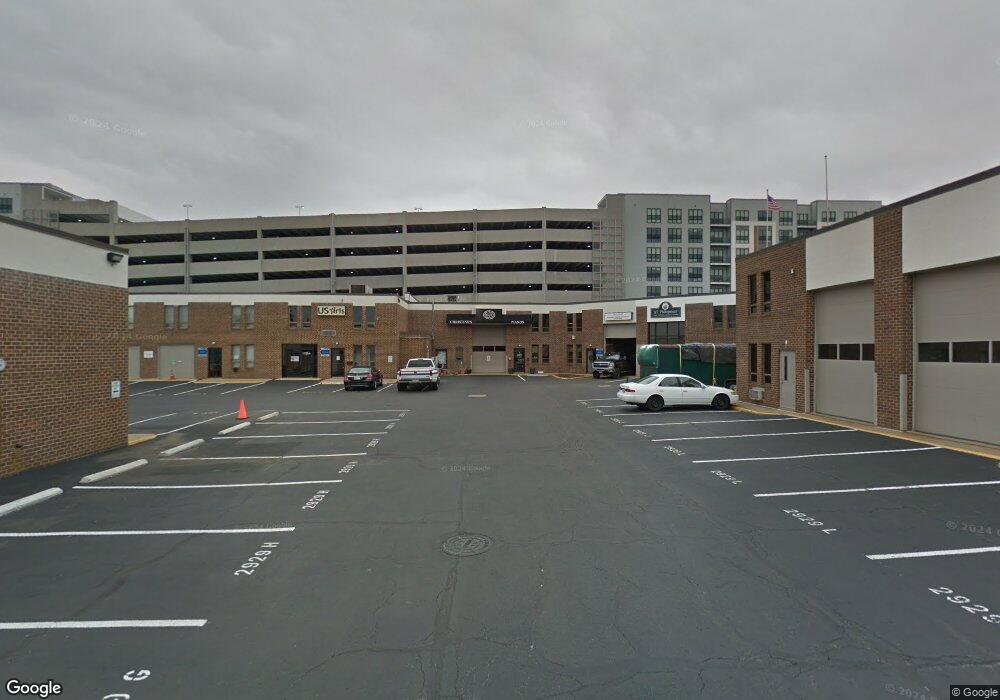
2929 Eskridge Rd Unit 2929-G Fairfax, VA 22031
Estimated Value: $1,326,199
--
Bed
--
Bath
3,598
Sq Ft
$369/Sq Ft
Est. Value
About This Home
This home is located at 2929 Eskridge Rd Unit 2929-G, Fairfax, VA 22031 and is currently estimated at $1,326,199, approximately $368 per square foot. 2929 Eskridge Rd Unit 2929-G is a home located in Fairfax County with nearby schools including Fairhill Elementary School, Luther Jackson Middle School, and Falls Church High School.
Ownership History
Date
Name
Owned For
Owner Type
Purchase Details
Closed on
Oct 3, 2024
Sold by
Joong-Ang Media Network Usa Inc and Joongangilbo Usa Inc
Bought by
Opal Properties Llc
Current Estimated Value
Home Financials for this Owner
Home Financials are based on the most recent Mortgage that was taken out on this home.
Original Mortgage
$1,176,500
Outstanding Balance
$1,164,387
Interest Rate
6.46%
Mortgage Type
Construction
Estimated Equity
$161,812
Purchase Details
Closed on
May 21, 2018
Sold by
Joong Ang Daily News Washington Inc
Bought by
Joong Ang Media Network Usa Inc
Purchase Details
Closed on
Oct 1, 2001
Sold by
Alliance Center L L C
Bought by
Joongang Daily News Washington
Home Financials for this Owner
Home Financials are based on the most recent Mortgage that was taken out on this home.
Original Mortgage
$360,000
Interest Rate
6.89%
Mortgage Type
Purchase Money Mortgage
Create a Home Valuation Report for This Property
The Home Valuation Report is an in-depth analysis detailing your home's value as well as a comparison with similar homes in the area
Home Values in the Area
Average Home Value in this Area
Purchase History
| Date | Buyer | Sale Price | Title Company |
|---|---|---|---|
| Opal Properties Llc | -- | Allied Title | |
| Joong Ang Media Network Usa Inc | $1,066,810 | None Available | |
| Joongang Daily News Washington | $515,000 | -- |
Source: Public Records
Mortgage History
| Date | Status | Borrower | Loan Amount |
|---|---|---|---|
| Open | Opal Properties Llc | $1,176,500 | |
| Previous Owner | Joongang Daily News Washington | $360,000 |
Source: Public Records
Tax History Compared to Growth
Tax History
| Year | Tax Paid | Tax Assessment Tax Assessment Total Assessment is a certain percentage of the fair market value that is determined by local assessors to be the total taxable value of land and additions on the property. | Land | Improvement |
|---|---|---|---|---|
| 2025 | $13,693 | $1,196,340 | $239,270 | $957,070 |
| 2024 | $13,693 | $1,066,810 | $213,360 | $853,450 |
| 2023 | $13,372 | $1,066,810 | $213,360 | $853,450 |
| 2022 | $13,532 | $1,066,810 | $213,360 | $853,450 |
| 2021 | $13,853 | $1,066,810 | $213,360 | $853,450 |
| 2020 | $13,959 | $1,066,810 | $213,360 | $853,450 |
| 2019 | $13,959 | $1,066,810 | $213,360 | $853,450 |
| 2018 | $12,268 | $1,066,810 | $213,360 | $853,450 |
| 2017 | $12,100 | $940,880 | $188,180 | $752,700 |
| 2016 | $9,767 | $760,980 | $152,200 | $608,780 |
| 2015 | $9,444 | $760,980 | $152,200 | $608,780 |
| 2014 | $9,425 | $760,980 | $152,200 | $608,780 |
Source: Public Records
Map
Nearby Homes
- 8154 Skelton Cir
- 8085 Gatehouse Rd Unit 4
- 2909 Charing Cross Rd Unit 12
- 2907 Charing Cross Rd Unit 14
- 8058 Genea Way Unit 48
- 2901 Charing Cross Rd Unit 12/8
- 3021 Nicosh Cir Unit 1108
- 8065 Nicosh Circle Ln Unit 55
- 2906 Kings Chapel Rd Unit 6/4
- 3003 Nicosh Cir Unit 3106
- 8006 Chanute Place Unit 10
- 2908 Kings Chapel Rd Unit 3/10
- 2900 Kings Chapel Rd Unit 1
- 8001 Chanute Place Unit 15
- 8147 Quinn Terrace
- 8002 Chanute Place Unit 8
- 8002 Chanute Place Unit 3
- 8109 Quinn Terrace
- 2802 Saint Croix Dr
- 2726 Gallows Rd Unit 1004
- 2929 Eskridge Rd Unit K
- 2929 Eskridge Rd Unit B
- 2929 Eskridge Rd Unit H
- 2929 Eskridge Rd Unit J
- 2929 Eskridge Rd
- 2929 Eskridge Rd
- 2929j Eskridge Rd
- 2929 Eskridge Road F
- 2929-U Eskridge Rd
- 2929-T Eskridge Rd
- 2929-S Eskridge Rd
- 2929-L Eskridge Rd
- 2929-J Eskridge Rd
- 2929-M Eskridge Rd
- 8325 Looking Glass Way
- 8321 Looking Glass Way
- 8319 Looking Glass Way
- 8317 Looking Glass Way
- 8323 Looking Glass Way
- 8327 Looking Glass Way