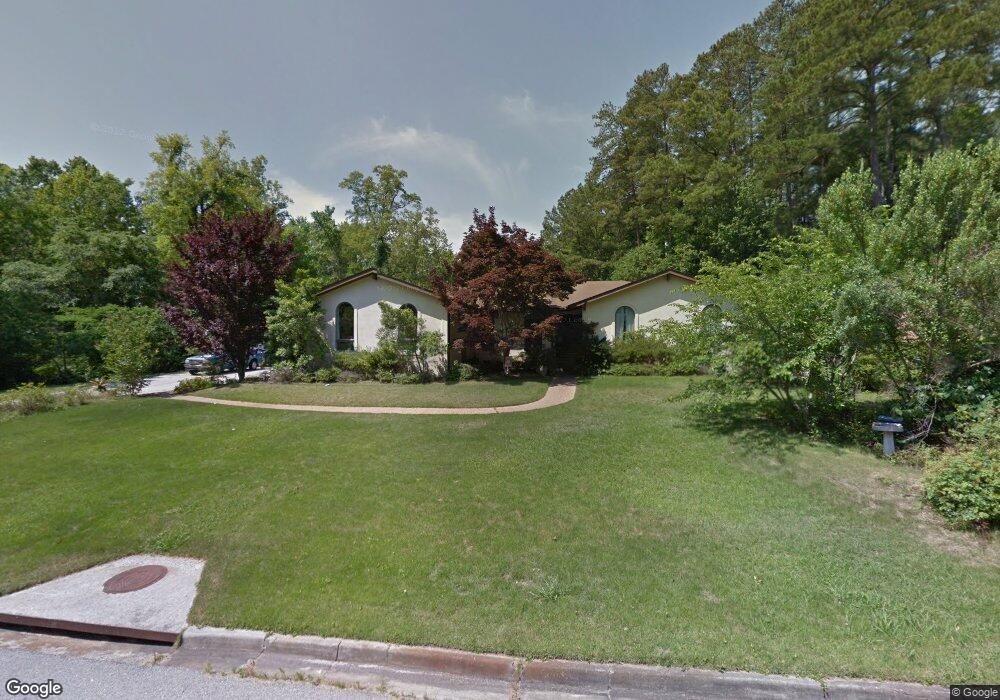
2929 Foxhall Cir Augusta, GA 30907
Montclair NeighborhoodEstimated Value: $391,000 - $412,000
5
Beds
3
Baths
3,086
Sq Ft
$131/Sq Ft
Est. Value
About This Home
This home is located at 2929 Foxhall Cir, Augusta, GA 30907 and is currently estimated at $404,888, approximately $131 per square foot. 2929 Foxhall Cir is a home located in Richmond County with nearby schools including Warren Road Elementary School, Tutt Middle School, and Johnson Magnet.
Ownership History
Date
Name
Owned For
Owner Type
Purchase Details
Closed on
Jul 6, 2007
Sold by
Brown Janice A and Harper Melanie C
Bought by
Lifsey Tom and Lifsey Cyndy H
Current Estimated Value
Purchase Details
Closed on
Jul 28, 2005
Sold by
Burmeister Susan Joyce and Burmeister William L
Bought by
Brown Janice A and Harper Melanie C
Home Financials for this Owner
Home Financials are based on the most recent Mortgage that was taken out on this home.
Original Mortgage
$160,000
Interest Rate
5.51%
Mortgage Type
Fannie Mae Freddie Mac
Create a Home Valuation Report for This Property
The Home Valuation Report is an in-depth analysis detailing your home's value as well as a comparison with similar homes in the area
Home Values in the Area
Average Home Value in this Area
Purchase History
| Date | Buyer | Sale Price | Title Company |
|---|---|---|---|
| Lifsey Tom | $245,000 | None Available | |
| Brown Janice A | $235,000 | -- |
Source: Public Records
Mortgage History
| Date | Status | Borrower | Loan Amount |
|---|---|---|---|
| Previous Owner | Brown Janice A | $160,000 |
Source: Public Records
Tax History Compared to Growth
Tax History
| Year | Tax Paid | Tax Assessment Tax Assessment Total Assessment is a certain percentage of the fair market value that is determined by local assessors to be the total taxable value of land and additions on the property. | Land | Improvement |
|---|---|---|---|---|
| 2025 | $1,630 | $147,596 | $14,000 | $133,596 |
| 2024 | $1,630 | $154,332 | $14,000 | $140,332 |
| 2023 | $1,657 | $142,924 | $14,000 | $128,924 |
| 2022 | $1,263 | $88,767 | $14,000 | $74,767 |
| 2021 | $1,256 | $79,086 | $14,000 | $65,086 |
| 2020 | $1,265 | $79,086 | $14,000 | $65,086 |
| 2019 | $2,668 | $75,246 | $14,000 | $61,246 |
| 2018 | $2,687 | $75,246 | $14,000 | $61,246 |
| 2017 | $2,670 | $75,246 | $14,000 | $61,246 |
| 2016 | $2,673 | $75,246 | $14,000 | $61,246 |
| 2015 | $2,691 | $75,246 | $14,000 | $61,246 |
| 2014 | $2,695 | $75,246 | $14,000 | $61,246 |
Source: Public Records
Map
Nearby Homes
- 2921 Foxhall Cir
- 2944 Foxhall Cir
- 2979 Foxhall Cir
- 2928 Running Creek Ln
- 9 Park Place Ct
- 3315 Sugar Mill Rd
- 2307 Creek View Dr
- 3305 Sugar Mill Rd
- 42 Park Place Cir
- 427 Shallowford Cir
- 429 Shallowford Cir
- 33 Londonberry Ln
- 54 Conifer Cir
- 3323 Ravenwood Dr
- 3311 Ansley Ct
- 431 Goldfinch Dr
- 6 Tall Pine Cir
- 306 Pleasant Home Rd
- 203 Buckhead Ct
- 225 Chatham Rd
- 2931 Foxhall Cir
- 2927 Foxhall Cir
- 2933 Foxhall Cir
- 2935 Foxhall Cir
- 2925 Foxhall Cir
- 2920 Foxhall Cir
- 2922 Foxhall Cir
- 2923 Foxhall Cir
- 2937 Foxhall Cir
- 2918 Foxhall Cir
- 680 Crane Creek Dr Unit ID1250944P
- 680 Crane Creek Dr
- 680 Crane Creek Dr
- 2315 Canebrake Ct
- 2939 Foxhall Cir
- 2916 Foxhall Cir
- 2924 Foxhall Cir
- 2313 Canebrake Ct
- 2919 Foxhall Cir
- 2914 Foxhall Cir