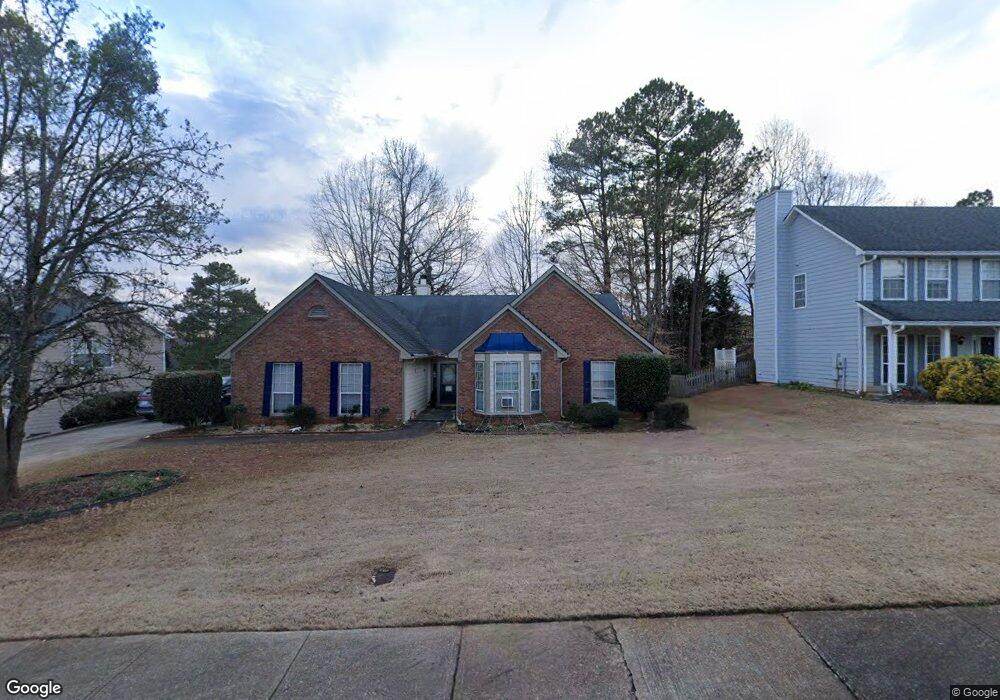
2929 Hickory Run Cir Unit 1 Duluth, GA 30096
Estimated Value: $451,044 - $489,000
3
Beds
2
Baths
2,502
Sq Ft
$189/Sq Ft
Est. Value
About This Home
This home is located at 2929 Hickory Run Cir Unit 1, Duluth, GA 30096 and is currently estimated at $473,511, approximately $189 per square foot. 2929 Hickory Run Cir Unit 1 is a home located in Gwinnett County with nearby schools including B.B. Harris Elementary School, Duluth Middle School, and Duluth High School.
Ownership History
Date
Name
Owned For
Owner Type
Purchase Details
Closed on
Feb 2, 2007
Sold by
Hitchcock John K and Hitchcock Linda M
Bought by
Benson Donal E and Benson Sandra L
Current Estimated Value
Home Financials for this Owner
Home Financials are based on the most recent Mortgage that was taken out on this home.
Original Mortgage
$215,307
Outstanding Balance
$127,079
Interest Rate
6.08%
Mortgage Type
FHA
Estimated Equity
$346,432
Purchase Details
Closed on
Jun 30, 1993
Sold by
Bomar Props Inc
Bought by
Hitchcock John K Linda M
Home Financials for this Owner
Home Financials are based on the most recent Mortgage that was taken out on this home.
Original Mortgage
$91,000
Interest Rate
7.49%
Create a Home Valuation Report for This Property
The Home Valuation Report is an in-depth analysis detailing your home's value as well as a comparison with similar homes in the area
Home Values in the Area
Average Home Value in this Area
Purchase History
| Date | Buyer | Sale Price | Title Company |
|---|---|---|---|
| Benson Donal E | $217,100 | -- | |
| Hitchcock John K Linda M | $126,000 | -- |
Source: Public Records
Mortgage History
| Date | Status | Borrower | Loan Amount |
|---|---|---|---|
| Open | Benson Donal E | $215,307 | |
| Previous Owner | Hitchcock John K Linda M | $91,000 |
Source: Public Records
Tax History
| Year | Tax Paid | Tax Assessment Tax Assessment Total Assessment is a certain percentage of the fair market value that is determined by local assessors to be the total taxable value of land and additions on the property. | Land | Improvement |
|---|---|---|---|---|
| 2025 | $5,432 | $196,040 | $29,920 | $166,120 |
| 2024 | $4,901 | $163,080 | $32,800 | $130,280 |
| 2023 | $4,901 | $171,440 | $28,000 | $143,440 |
| 2022 | $5,040 | $171,440 | $28,000 | $143,440 |
| 2021 | $4,139 | $124,880 | $20,000 | $104,880 |
| 2020 | $4,167 | $124,880 | $20,000 | $104,880 |
| 2019 | $3,641 | $105,960 | $16,000 | $89,960 |
| 2018 | $3,645 | $105,960 | $16,000 | $89,960 |
| 2016 | $3,117 | $83,640 | $16,000 | $67,640 |
| 2015 | $2,839 | $74,960 | $16,000 | $58,960 |
| 2014 | -- | $73,160 | $16,000 | $57,160 |
Source: Public Records
Map
Nearby Homes
- 2895 Dogwood Creek Pkwy Unit 1
- 2790 Dogwood Creek Pkwy
- 2770 Dogwood Creek Pkwy
- 2741 Willowstone Dr
- 2240 Siskin Square Rd
- 2240 Siskin Square Rd Unit 88
- 2280 Siskin Square Rd Unit 92
- 3161 Willowstone Dr
- 2772 Evanshire Ave Unit 106
- 2802 Evanshire Ave Unit 109
- 2812 Evanshire Ave Unit 110
- 2832 Evanshire Ave Unit 112
- 2842 Evanshire Ave Unit 113
- 2852 Evanshire Ave Unit 114
- 2822 Evanshire Ave Unit 111
- 2862 Evanshire Ave Unit 115
- 3196 Moor View Rd Unit 27
- 2893 Thurleston Ln
- 2775 Whippoorwill Cir
- 3057 Orchard Ridge Cir
- 2909 Hickory Run Cir
- 2939 Hickory Run Cir
- 2875 Dogwood Creek Pkwy
- 2899 Hickory Run Cir
- 2885 Dogwood Creek Pkwy Unit 1
- 2914 Hickory Run Cir
- 2959 Hickory Run Cir Unit 1
- 2924 Hickory Run Cir Unit 1
- 2904 Hickory Run Cir
- 2934 Hickory Run Cir Unit 1
- 2889 Hickory Run Cir
- 2944 Hickory Run Cir
- 2884 Hickory Run Cir
- 2954 Hickory Run Cir
- 2915 Dogwood Creek Pkwy
- 2988 Willowstone Dr Unit 25
- 2988 Willowstone Dr
- 2915 Dogwood Creek Pkwy NW
- 2978 Willowstone Dr
- 2880 Dogwood Creek Pkwy
Your Personal Tour Guide
Ask me questions while you tour the home.