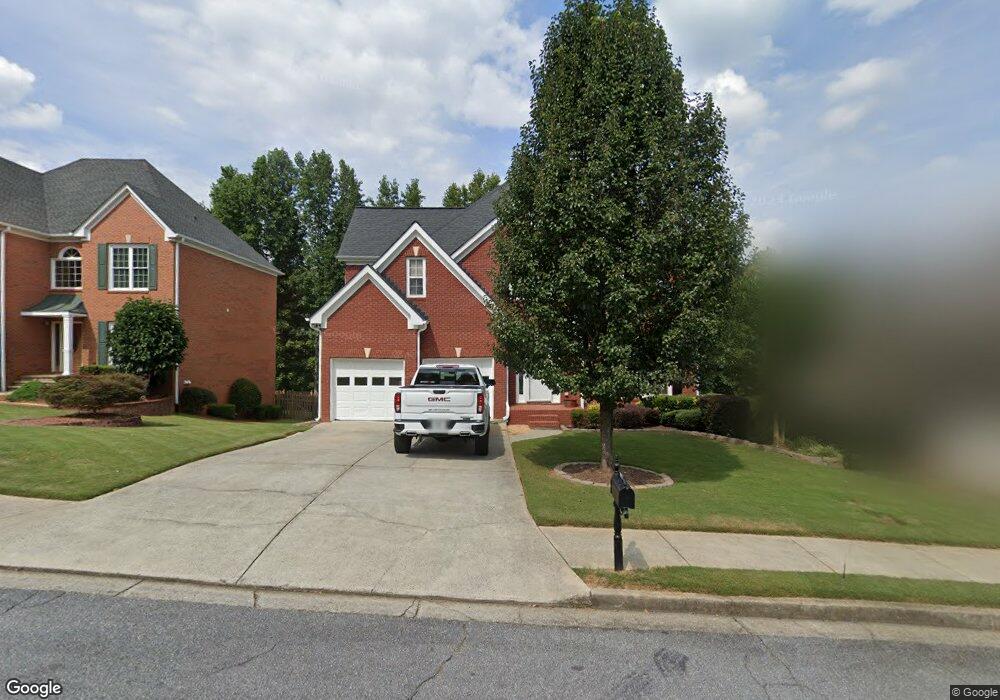
2929 Savannah Walk Ln Suwanee, GA 30024
Estimated Value: $609,000 - $650,000
4
Beds
3
Baths
2,698
Sq Ft
$232/Sq Ft
Est. Value
About This Home
This home is located at 2929 Savannah Walk Ln, Suwanee, GA 30024 and is currently estimated at $624,938, approximately $231 per square foot. 2929 Savannah Walk Ln is a home located in Gwinnett County with nearby schools including Parsons Elementary School, Hull Middle School, and Peachtree Ridge High School.
Ownership History
Date
Name
Owned For
Owner Type
Purchase Details
Closed on
Aug 4, 2008
Sold by
Ahmed Zulsiquar and Ahmed Marielba
Bought by
Lundmark Michael W
Current Estimated Value
Home Financials for this Owner
Home Financials are based on the most recent Mortgage that was taken out on this home.
Original Mortgage
$304,458
Outstanding Balance
$199,129
Interest Rate
6.43%
Mortgage Type
FHA
Estimated Equity
$425,809
Purchase Details
Closed on
Nov 10, 2000
Sold by
Vemuru Vemuru V and Vemuru Radhika K
Bought by
Ahmed Marielba
Home Financials for this Owner
Home Financials are based on the most recent Mortgage that was taken out on this home.
Original Mortgage
$187,000
Interest Rate
10.38%
Mortgage Type
New Conventional
Purchase Details
Closed on
Mar 14, 1997
Sold by
Bowen Bowen Const Co Inc
Bought by
Vemuru V Raghunatha R Rod
Create a Home Valuation Report for This Property
The Home Valuation Report is an in-depth analysis detailing your home's value as well as a comparison with similar homes in the area
Home Values in the Area
Average Home Value in this Area
Purchase History
| Date | Buyer | Sale Price | Title Company |
|---|---|---|---|
| Lundmark Michael W | $310,000 | -- | |
| Ahmed Marielba | $220,000 | -- | |
| Vemuru V Raghunatha R Rod | $170,000 | -- |
Source: Public Records
Mortgage History
| Date | Status | Borrower | Loan Amount |
|---|---|---|---|
| Open | Lundmark Michael W | $304,458 | |
| Previous Owner | Ahmed Marielba | $187,000 | |
| Closed | Vemuru V Raghunatha R Rod | $0 |
Source: Public Records
Tax History Compared to Growth
Tax History
| Year | Tax Paid | Tax Assessment Tax Assessment Total Assessment is a certain percentage of the fair market value that is determined by local assessors to be the total taxable value of land and additions on the property. | Land | Improvement |
|---|---|---|---|---|
| 2025 | $6,467 | $249,400 | $48,240 | $201,160 |
| 2024 | $6,382 | $236,960 | $38,800 | $198,160 |
| 2023 | $6,382 | $236,960 | $38,800 | $198,160 |
| 2022 | $5,297 | $185,800 | $30,000 | $155,800 |
| 2021 | $4,533 | $145,080 | $22,000 | $123,080 |
| 2020 | $4,567 | $145,080 | $22,000 | $123,080 |
| 2019 | $4,449 | $145,080 | $22,000 | $123,080 |
| 2018 | $4,120 | $129,480 | $19,200 | $110,280 |
| 2016 | $3,647 | $106,720 | $17,600 | $89,120 |
| 2015 | $3,682 | $106,720 | $17,600 | $89,120 |
| 2014 | -- | $98,480 | $15,200 | $83,280 |
Source: Public Records
Map
Nearby Homes
- 1485 Oglethorpe Run Ln
- 2670 Factor Walk Blvd
- 2680 Factor Walk Blvd
- 2645 Factor Walk Blvd
- 1557 Andrew Hills Ct
- 2994 Meadow Church Rd Unit 2
- 1043 Nightfall Ct NW
- 1190 Saint Ives Ct
- 1660 Briergate Dr
- 1760 Berkshire Hill Dr
- 2426 Strand Ave
- 1658 Walden Pond Rd
- 3068 Prestwyck Haven Dr
- 2380 Harshaw Ave
- 2381 Harshaw Ave
- 1207 Penhurst Way
- 1210 Swan Mill Ct
- 2651 Heathrow Dr
- 2341 Bellefonte Ave
- 3341 Danielle Way
- 2919 Savannah Walk Ln Unit 3
- 2939 Savannah Walk Ln Unit 3
- 1535 Oglethorpe Run Ln
- 2855 Olde Savannah Cove
- 1525 Oglethorpe Run Ln
- 2865 Olde Savannah Cove Unit 5
- 2823 Oglethorpe Run Square
- 1574 Oglethorpe Dr
- 1564 Oglethorpe Dr Unit 1
- 2828 Oglethorpe Run Square
- 2870 Olde Savannah Cove
- 1515 Oglethorpe Run Ln Unit 3
- 1530 Oglethorpe Run Ln
- 2908 Savannah Walk Ln
- 2845 Olde Savannah Cove Unit 5
- 1554 Oglethorpe Dr
- 1510 Oglethorpe Run Ln Unit 3
- 1579 Oglethorpe Dr
- 1505 Oglethorpe Run Ln
- 2850 Olde Savannah Cove Unit 5