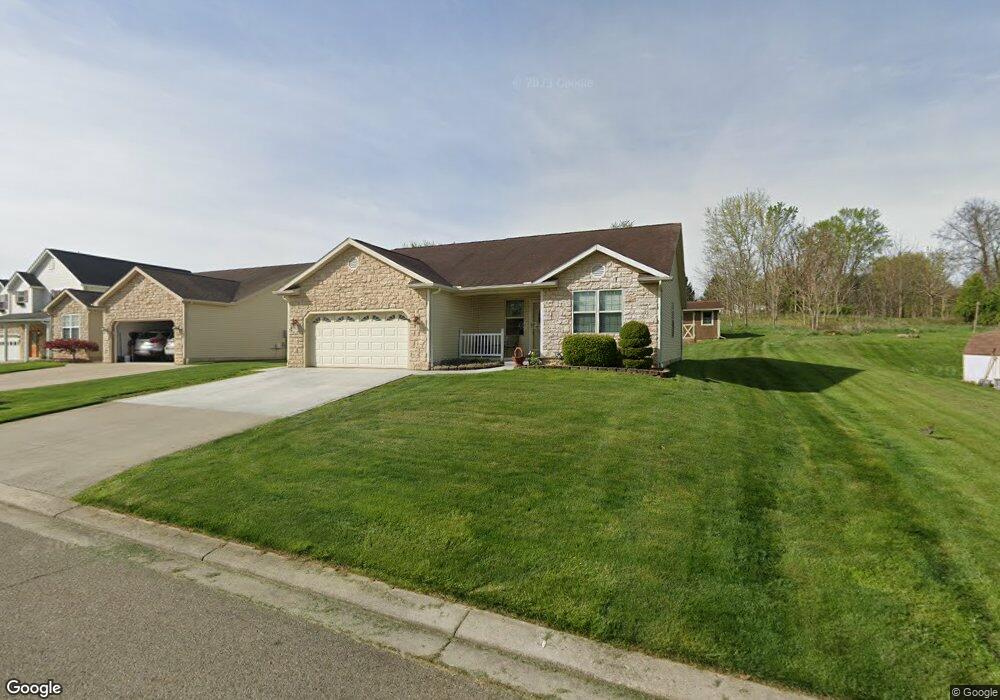
293 Alcon Dr Newark, OH 43055
Estimated Value: $252,000 - $298,000
3
Beds
2
Baths
1,383
Sq Ft
$191/Sq Ft
Est. Value
About This Home
This home is located at 293 Alcon Dr, Newark, OH 43055 and is currently estimated at $264,545, approximately $191 per square foot. 293 Alcon Dr is a home located in Licking County with nearby schools including Carson Elementary School, Heritage Middle School, and Newark High School.
Ownership History
Date
Name
Owned For
Owner Type
Purchase Details
Closed on
Jul 18, 2017
Sold by
Mcknight James A
Bought by
Mcmannis Max D and Mcmannis Mary Ann
Current Estimated Value
Purchase Details
Closed on
Jul 30, 2008
Sold by
Ferrell Dallas B and Ferrell Donna K
Bought by
Mcknight James A and Mcknight Cheryl D
Home Financials for this Owner
Home Financials are based on the most recent Mortgage that was taken out on this home.
Original Mortgage
$95,000
Interest Rate
6.5%
Mortgage Type
Unknown
Purchase Details
Closed on
Oct 27, 2006
Sold by
Wills Greg D and Wills Lisa F
Bought by
Ferrell Dallas B and Ferrell Donna K
Home Financials for this Owner
Home Financials are based on the most recent Mortgage that was taken out on this home.
Original Mortgage
$55,000
Interest Rate
6.5%
Mortgage Type
Unknown
Create a Home Valuation Report for This Property
The Home Valuation Report is an in-depth analysis detailing your home's value as well as a comparison with similar homes in the area
Home Values in the Area
Average Home Value in this Area
Purchase History
| Date | Buyer | Sale Price | Title Company |
|---|---|---|---|
| Mcmannis Max D | $141,000 | None Available | |
| Mcknight James A | $130,000 | Lawyers | |
| Ferrell Dallas B | $115,000 | None Available |
Source: Public Records
Mortgage History
| Date | Status | Borrower | Loan Amount |
|---|---|---|---|
| Previous Owner | Mcknight James A | $95,000 | |
| Previous Owner | Ferrell Dallas B | $55,000 |
Source: Public Records
Tax History Compared to Growth
Tax History
| Year | Tax Paid | Tax Assessment Tax Assessment Total Assessment is a certain percentage of the fair market value that is determined by local assessors to be the total taxable value of land and additions on the property. | Land | Improvement |
|---|---|---|---|---|
| 2024 | $1,889 | $62,620 | $16,870 | $45,750 |
| 2023 | $3,336 | $62,620 | $16,870 | $45,750 |
| 2022 | $1,595 | $48,480 | $9,870 | $38,610 |
| 2021 | $53 | $48,480 | $9,870 | $38,610 |
| 2020 | $54 | $48,480 | $9,870 | $38,610 |
| 2019 | $15 | $42,530 | $8,960 | $33,570 |
| 2018 | $15 | $0 | $0 | $0 |
| 2017 | $524 | $0 | $0 | $0 |
| 2016 | $6 | $0 | $0 | $0 |
| 2015 | $3 | $0 | $0 | $0 |
| 2014 | $3 | $0 | $0 | $0 |
| 2013 | $6 | $0 | $0 | $0 |
Source: Public Records
Map
Nearby Homes
- 934 Garfield Ave
- 87 Liberty Ave
- 952 Emerson St
- 688 Russell Ave
- 554 Garfield Ave
- 0 Swans Rd NE
- 506 Lexington Ave
- 483 Allston Ave
- 491 Garfield Ave
- 240 N Wing St
- 460 Allston Ave
- 424 Ridge Ave
- 81 Madison Ave
- 76 Oakwood Ave
- 167 Essex St
- 160 N Cedar St
- 400 Brentwood Dr NE
- 430 E Main St
- 1791 Staddens Bridge Rd SE
- 394 Brentwood Dr NE