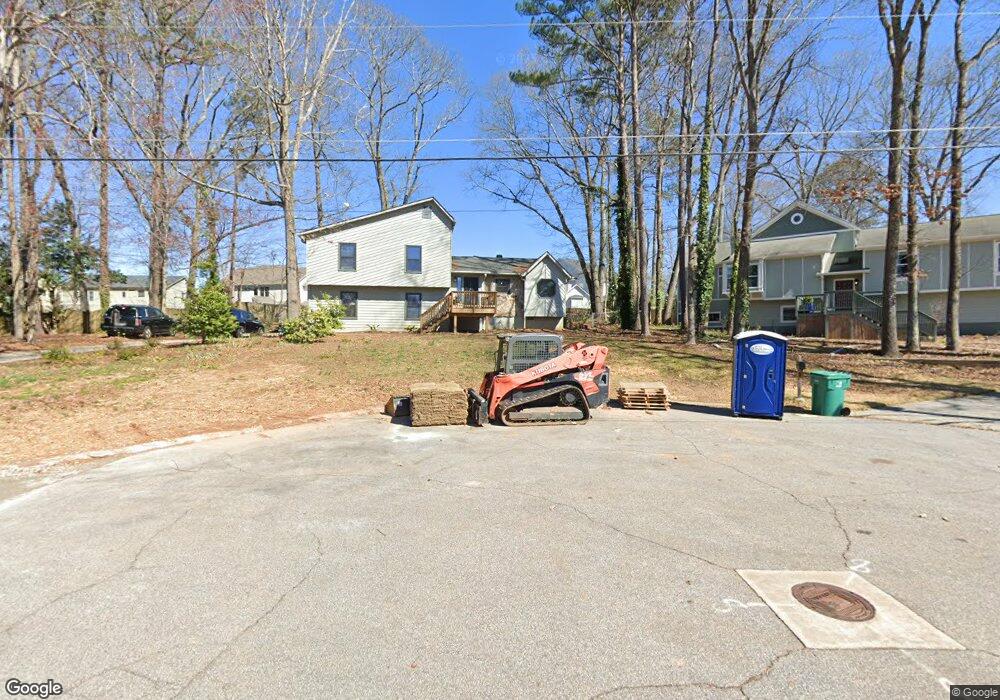
293 Doeskin Ln SE Smyrna, GA 30082
Estimated Value: $320,000 - $409,000
3
Beds
2
Baths
1,386
Sq Ft
$256/Sq Ft
Est. Value
About This Home
This home is located at 293 Doeskin Ln SE, Smyrna, GA 30082 and is currently estimated at $355,291, approximately $256 per square foot. 293 Doeskin Ln SE is a home located in Cobb County with nearby schools including King Springs Elementary School, Griffin Middle School, and Campbell High School.
Ownership History
Date
Name
Owned For
Owner Type
Purchase Details
Closed on
Feb 20, 2009
Sold by
Federal Home Loan Mortgage Corporation
Bought by
Ross Michael B
Current Estimated Value
Home Financials for this Owner
Home Financials are based on the most recent Mortgage that was taken out on this home.
Original Mortgage
$108,007
Outstanding Balance
$68,017
Interest Rate
5.03%
Mortgage Type
FHA
Estimated Equity
$287,274
Purchase Details
Closed on
Oct 7, 2008
Sold by
Southtrust Mortgage Corp
Bought by
Federal Home Loan Mortgage Corporation
Purchase Details
Closed on
Dec 1, 1999
Sold by
Mckay Monelle
Bought by
Evans Larry E
Home Financials for this Owner
Home Financials are based on the most recent Mortgage that was taken out on this home.
Original Mortgage
$94,500
Interest Rate
7.68%
Mortgage Type
New Conventional
Purchase Details
Closed on
Aug 22, 1995
Sold by
Larson Michael S Susan
Bought by
Mckay Monelle
Create a Home Valuation Report for This Property
The Home Valuation Report is an in-depth analysis detailing your home's value as well as a comparison with similar homes in the area
Home Values in the Area
Average Home Value in this Area
Purchase History
| Date | Buyer | Sale Price | Title Company |
|---|---|---|---|
| Ross Michael B | -- | -- | |
| Federal Home Loan Mortgage Corporation | -- | -- | |
| Southtrust Mortgage Corp | $87,720 | -- | |
| Evans Larry E | $105,000 | -- | |
| Mckay Monelle | $13,000 | -- |
Source: Public Records
Mortgage History
| Date | Status | Borrower | Loan Amount |
|---|---|---|---|
| Open | Ross Michael B | $108,007 | |
| Previous Owner | Evans Larry E | $94,500 | |
| Closed | Mckay Monelle | $0 |
Source: Public Records
Tax History Compared to Growth
Tax History
| Year | Tax Paid | Tax Assessment Tax Assessment Total Assessment is a certain percentage of the fair market value that is determined by local assessors to be the total taxable value of land and additions on the property. | Land | Improvement |
|---|---|---|---|---|
| 2025 | $3,005 | $147,172 | $44,000 | $103,172 |
| 2024 | $2,927 | $142,972 | $40,000 | $102,972 |
| 2023 | $2,154 | $127,768 | $20,000 | $107,768 |
| 2022 | $2,666 | $127,768 | $20,000 | $107,768 |
| 2021 | $2,388 | $112,296 | $20,000 | $92,296 |
| 2020 | $2,134 | $98,920 | $20,000 | $78,920 |
| 2019 | $2,134 | $98,920 | $20,000 | $78,920 |
| 2018 | $1,815 | $82,156 | $20,000 | $62,156 |
| 2017 | $1,347 | $62,240 | $20,000 | $42,240 |
| 2016 | $1,348 | $62,240 | $20,000 | $42,240 |
| 2015 | $1,381 | $62,240 | $20,000 | $42,240 |
| 2014 | $1,070 | $50,000 | $0 | $0 |
Source: Public Records
Map
Nearby Homes
- 524 Tackett Farms Rd
- 317 Highview Dr SE
- 418 Mockingbird Ln SE
- 4195 Antler Trail SE
- 1375 Mosswood Ln SE
- 465 Willowbrook Dr SE
- 4246 Antler Trail SE
- 4025 Benell Ct SE
- 436 Concord Rd SE
- 576 N Thomas Ln SE
- 22 Vanessa Dr SE Unit 8
- 3910 W Cooper Lake Dr SE
- 14 Geraldine Dr SE
- 22 Geraldine Dr SE
- 18 Geraldine Dr SE
- 63 Geraldine Dr SE
- 3664 Nessa Ct SE
- 538 Micayne Cir SE Unit 3
- 88 Lucia Dr SE Unit 5
- 701 Rosedale Dr SE
- 3945 Obryant Cir SE
- 303 Doeskin Ln SE
- 285 Doeskin Ln SE
- 3941 Obryant Cir SE
- 313 Doeskin Ln SE
- 3949 Obryant Cir SE
- 273 Doeskin Ln SE
- 322 Doeskin Ln SE
- 3953 O'Bryant Cir
- 3937 O'Bryant Cir
- 3937 O'Bryant Cir Unit Lot 18
- 282 Doeskin Ln SE
- 323 Doeskin Ln SE
- 3954 Manson Ave SE
- 3957 O'Bryant Cir
- 263 Doeskin Ln SE
- 332 Doeskin Ln SE
- 3966 Manson Ave SE
- 3933 Obryant Cir SE
- 3940 Manson Ave SE