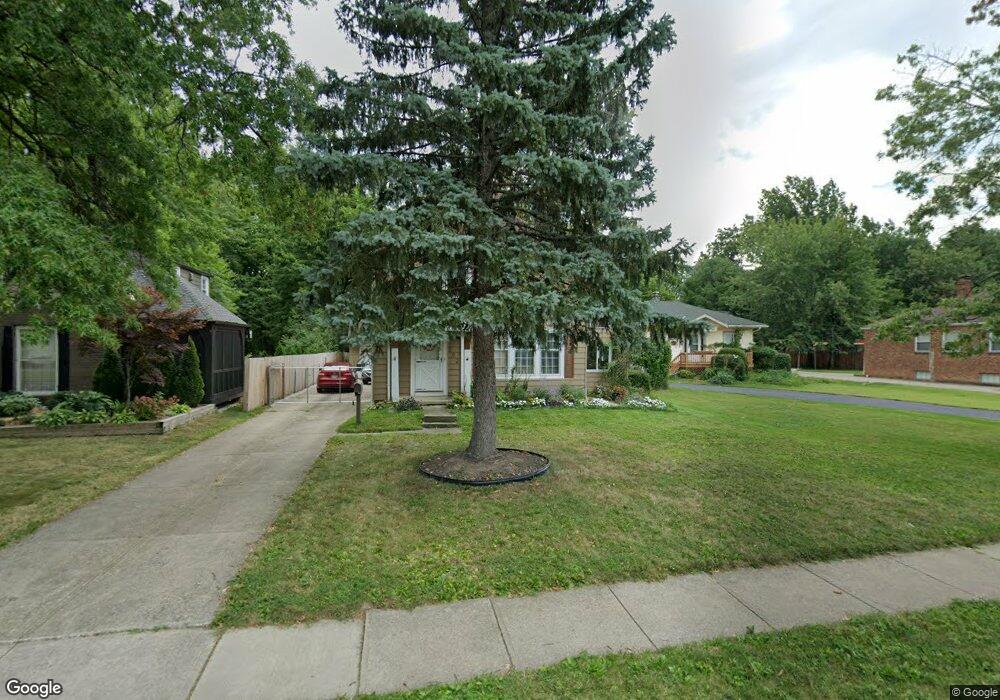
293 E 266th St Euclid, OH 44132
Estimated Value: $158,919 - $182,000
3
Beds
2
Baths
1,350
Sq Ft
$127/Sq Ft
Est. Value
About This Home
This home is located at 293 E 266th St, Euclid, OH 44132 and is currently estimated at $171,730, approximately $127 per square foot. 293 E 266th St is a home located in Cuyahoga County with nearby schools including Shoreview Elementary School, Euclid High School, and Ss Robert & William Catholic School.
Ownership History
Date
Name
Owned For
Owner Type
Purchase Details
Closed on
Jul 12, 2011
Sold by
New Millenium Inner Visions Llc
Bought by
Hartley Robert C
Current Estimated Value
Home Financials for this Owner
Home Financials are based on the most recent Mortgage that was taken out on this home.
Original Mortgage
$61,402
Outstanding Balance
$1,849
Interest Rate
4.4%
Mortgage Type
FHA
Estimated Equity
$169,881
Purchase Details
Closed on
Nov 26, 2010
Sold by
Fannie Mae
Bought by
New Millenium Inner Visions Llc
Purchase Details
Closed on
Aug 10, 2010
Sold by
Gould Bonnie M
Bought by
Federal National Mortgage Association
Purchase Details
Closed on
Apr 16, 1984
Sold by
Gould Wayne W and Gould Bonnie W
Bought by
Gould Wayne W
Purchase Details
Closed on
Jan 1, 1975
Bought by
Gould Wayne W and Gould Bonnie W
Create a Home Valuation Report for This Property
The Home Valuation Report is an in-depth analysis detailing your home's value as well as a comparison with similar homes in the area
Home Values in the Area
Average Home Value in this Area
Purchase History
| Date | Buyer | Sale Price | Title Company |
|---|---|---|---|
| Hartley Robert C | $63,000 | Chicago Title Insurance Co | |
| New Millenium Inner Visions Llc | $31,500 | Ohio Title Corp | |
| Federal National Mortgage Association | $33,334 | Attorney | |
| Gould Wayne W | -- | -- | |
| Gould Wayne W | -- | -- |
Source: Public Records
Mortgage History
| Date | Status | Borrower | Loan Amount |
|---|---|---|---|
| Open | Hartley Robert C | $61,402 |
Source: Public Records
Tax History
| Year | Tax Paid | Tax Assessment Tax Assessment Total Assessment is a certain percentage of the fair market value that is determined by local assessors to be the total taxable value of land and additions on the property. | Land | Improvement |
|---|---|---|---|---|
| 2025 | $3,149 | $47,250 | $10,955 | $36,295 |
| 2024 | $3,256 | $47,250 | $10,955 | $36,295 |
| 2023 | $3,232 | $36,860 | $8,300 | $28,560 |
| 2022 | $3,072 | $36,470 | $8,300 | $28,180 |
| 2021 | $3,423 | $36,470 | $8,300 | $28,180 |
| 2020 | $3,244 | $31,430 | $7,140 | $24,290 |
| 2019 | $2,918 | $89,800 | $20,400 | $69,400 |
| 2018 | $2,892 | $31,430 | $7,140 | $24,290 |
| 2017 | $3,080 | $27,450 | $5,920 | $21,530 |
| 2016 | $3,087 | $27,450 | $5,920 | $21,530 |
| 2015 | $2,809 | $27,450 | $5,920 | $21,530 |
| 2014 | $2,809 | $27,450 | $5,920 | $21,530 |
Source: Public Records
Map
Nearby Homes
- 298 E 270th St
- 325 E 264th St
- 257 E 270th St
- 411 E 270th St
- 440 E 271st St
- 406 E 274th St
- 25801 Lakeshore Blvd Unit 42
- 25801 Lake Shore Blvd Unit 29
- 25801 Lake Shore Blvd Unit 112
- 218 Wells Ct
- 325 E 257th St
- 427 E 275th St
- 355 E 257th St
- 25591 Forestview Ave
- 26831 Shoreview Ave
- 26931 Shoreview Ave
- 295 E 276th St
- 610 E 266th St
- 26171 Shoreview Ave
- 26530 Shoreview Ave
Your Personal Tour Guide
Ask me questions while you tour the home.