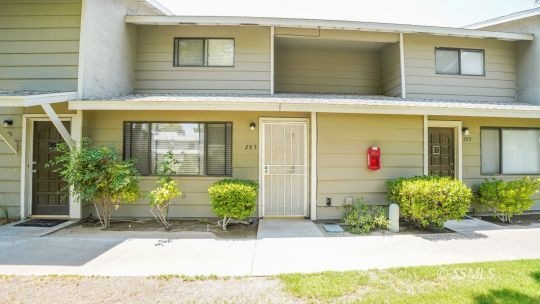
293 E Upjohn Ave Unit C Ridgecrest, CA 93555
Estimated payment $1,342/month
Highlights
- Private Pool
- 1.59 Acre Lot
- Walk-In Closet
- Burroughs High School Rated A-
- 2 Car Attached Garage
- Two cooling system units
About This Home
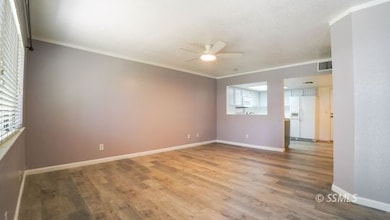
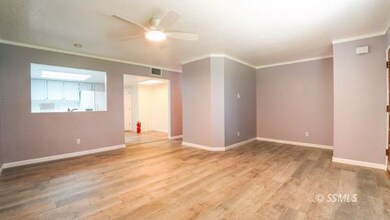
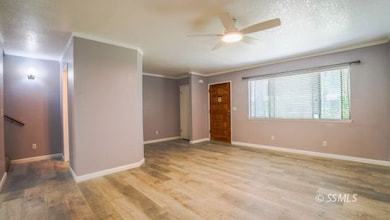
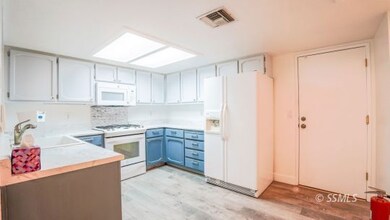
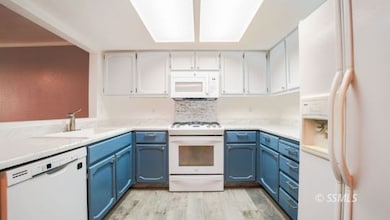
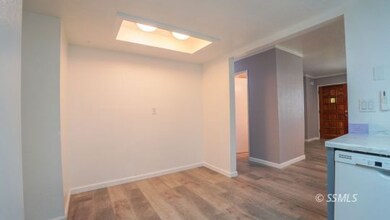
Welcome to this beautifully maintained 2-bed, 2.5-bath townhome in Green Acres Estates! Located within a half-mile of shopping and city amenities, this home offers both comfort and convenience. Downstairs features new laminate flooring, a spacious living area, updated kitchen, and a half bath. Upstairs, both bedrooms include private full baths, and one offers a walk-in closet. Recent upgrades include a brand-new water heater and a dual-pack HVAC system installed approx. 4"5 years ago. Enjoy community perks like well-kept grassy common areas, front landscaping, and access to the neighborhood pool-all covered by the HOA. A move-in ready home in a great location! Don't miss your chance to enjoy comfort and convenience!
Listing Agent
Coldwell Banker Frontier Brokerage Phone: (760) 375-3855 License #01880925 Listed on: 07/15/2025

Townhouse Details
Home Type
- Townhome
Est. Annual Taxes
- $1,369
Year Built
- Built in 1986
HOA Fees
- $174 Monthly HOA Fees
Parking
- 2 Car Attached Garage
Home Design
- Slab Foundation
- Shingle Roof
- Stucco Exterior
Interior Spaces
- 1,288 Sq Ft Home
- Ceiling Fan
- Washer and Dryer Hookup
Kitchen
- Oven or Range
- Dishwasher
Flooring
- Carpet
- Laminate
Bedrooms and Bathrooms
- 2 Bedrooms
- Walk-In Closet
Pool
- Private Pool
Utilities
- Two cooling system units
- Two Heating Systems
- Master Meter
- Natural Gas Connected
Community Details
- Association fees include garbage common areas landscaping
- Green Acres Townhomes Subdivision
Listing and Financial Details
- Assessor Parcel Number 080-320-25
Map
Home Values in the Area
Average Home Value in this Area
Tax History
| Year | Tax Paid | Tax Assessment Tax Assessment Total Assessment is a certain percentage of the fair market value that is determined by local assessors to be the total taxable value of land and additions on the property. | Land | Improvement |
|---|---|---|---|---|
| 2025 | $1,369 | $79,635 | $14,470 | $65,165 |
| 2024 | $1,369 | $78,075 | $14,187 | $63,888 |
| 2023 | $1,332 | $76,545 | $13,909 | $62,636 |
| 2022 | $1,305 | $75,045 | $13,637 | $61,408 |
| 2021 | $1,242 | $73,574 | $13,370 | $60,204 |
| 2020 | $1,206 | $72,820 | $13,233 | $59,587 |
| 2019 | $1,190 | $72,820 | $13,233 | $59,587 |
| 2018 | $1,156 | $69,994 | $12,720 | $57,274 |
| 2017 | $1,153 | $68,622 | $12,471 | $56,151 |
| 2016 | $1,111 | $67,277 | $12,227 | $55,050 |
| 2015 | $1,093 | $66,268 | $12,044 | $54,224 |
| 2014 | $985 | $64,971 | $11,809 | $53,162 |
Property History
| Date | Event | Price | List to Sale | Price per Sq Ft |
|---|---|---|---|---|
| 10/27/2025 10/27/25 | Pending | -- | -- | -- |
| 08/19/2025 08/19/25 | Price Changed | $199,900 | -2.5% | $155 / Sq Ft |
| 07/15/2025 07/15/25 | For Sale | $205,000 | -- | $159 / Sq Ft |
Purchase History
| Date | Type | Sale Price | Title Company |
|---|---|---|---|
| Warranty Deed | -- | None Available | |
| Warranty Deed | -- | None Available | |
| Warranty Deed | $55,000 | First American Title | |
| Warranty Deed | $34,500 | First American Title Co |
Mortgage History
| Date | Status | Loan Amount | Loan Type |
|---|---|---|---|
| Previous Owner | $54,150 | No Value Available | |
| Previous Owner | $34,834 | No Value Available |
Source: Southern Sierra MLS
MLS Number: 2607336
APN: 080-320-25-00-0
- 179 E Upjohn Ave
- 177 E Upjohn Ave
- 325 E Wilson Ave
- 115 W Haloid Ave
- 700 S Silver Ridge St Unit 58
- 700 S Silver Ridge St Unit 8
- 329 E Church Ave
- 128 W Haloid Ave
- 200 W Upjohn Ave
- 211 & 215 California
- 219 W Haloid Ave
- 133 S Silver Ridge St
- 224 W Wilson Ave
- 200 W Mariposa Ave
- 384 E California Ave
- 613 Heatherglen Dr
- 206 S Holly Canyon Dr
- 229 Rancho St
- 218 S Sunland St
- 601 E Church Ave