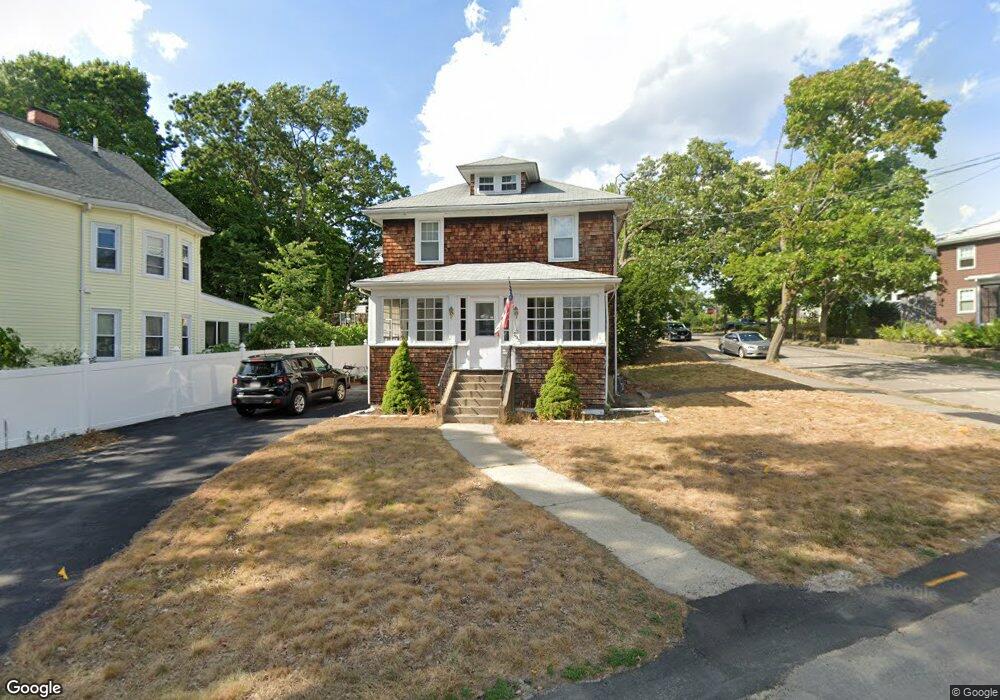
293 Holbrook Rd Quincy, MA 02171
West Quincy NeighborhoodEstimated Value: $652,000 - $738,000
3
Beds
1
Bath
1,300
Sq Ft
$531/Sq Ft
Est. Value
About This Home
This home is located at 293 Holbrook Rd, Quincy, MA 02171 and is currently estimated at $690,592, approximately $531 per square foot. 293 Holbrook Rd is a home located in Norfolk County with nearby schools including Montclair Elementary School, Atlantic Middle School, and North Quincy High School.
Ownership History
Date
Name
Owned For
Owner Type
Purchase Details
Closed on
Nov 23, 1999
Sold by
Robinson M Rita
Bought by
Manning Michael
Current Estimated Value
Home Financials for this Owner
Home Financials are based on the most recent Mortgage that was taken out on this home.
Original Mortgage
$175,000
Outstanding Balance
$53,467
Interest Rate
7.76%
Mortgage Type
Purchase Money Mortgage
Estimated Equity
$637,125
Create a Home Valuation Report for This Property
The Home Valuation Report is an in-depth analysis detailing your home's value as well as a comparison with similar homes in the area
Home Values in the Area
Average Home Value in this Area
Purchase History
| Date | Buyer | Sale Price | Title Company |
|---|---|---|---|
| Manning Michael | $190,000 | -- |
Source: Public Records
Mortgage History
| Date | Status | Borrower | Loan Amount |
|---|---|---|---|
| Open | Manning Michael | $90,615 | |
| Open | Manning Michael | $175,000 |
Source: Public Records
Tax History
| Year | Tax Paid | Tax Assessment Tax Assessment Total Assessment is a certain percentage of the fair market value that is determined by local assessors to be the total taxable value of land and additions on the property. | Land | Improvement |
|---|---|---|---|---|
| 2025 | $7,094 | $615,300 | $336,000 | $279,300 |
| 2024 | $6,870 | $609,600 | $336,000 | $273,600 |
| 2023 | $6,389 | $574,000 | $320,000 | $254,000 |
| 2022 | $6,127 | $511,400 | $278,300 | $233,100 |
| 2021 | $5,939 | $489,200 | $265,000 | $224,200 |
| 2020 | $5,804 | $466,900 | $265,000 | $201,900 |
| 2019 | $5,522 | $440,000 | $247,700 | $192,300 |
| 2018 | $5,424 | $406,600 | $229,300 | $177,300 |
| 2017 | $5,230 | $369,100 | $218,400 | $150,700 |
| 2016 | $4,753 | $331,000 | $189,900 | $141,100 |
| 2015 | $4,402 | $301,500 | $172,600 | $128,900 |
| 2014 | $4,238 | $285,200 | $164,400 | $120,800 |
Source: Public Records
Map
Nearby Homes
- 30 Elmwood Park
- 0 Franklin St
- 281 Elmwood Ave
- 115 W Squantum St Unit 517
- 115 W Squantum St Unit 203
- 115 W Squantum St Unit 811
- 54 Safford St
- 154 N Central Ave
- 98 Safford St
- 17 Albany St
- 100 W Squantum St Unit 411
- 107 Fayette St
- 400 Adams St Unit A
- 17 Holmes St Unit 204
- 17 Holmes St Unit 2
- 17 Holmes St Unit 1
- 397 Adams St
- 440 Granite Ave Unit 201
- 267-269 Farrington St
- 1185 Brook Rd
- 301 Holbrook Rd
- 47 Barham Ave
- 49 Barham Ave
- 61 Barham Ave
- 21 Evelyn Place
- 302 Holbrook Rd
- 285 Holbrook Rd
- 62 Barham Ave
- 41 Barham Ave
- 34 Clement Terrace
- 44 Barham Ave
- 69 Barham Ave
- 44 Barham Ave
- 68 Barham Ave
- 278 Holbrook Rd
- 278 Holbrook Rd Unit 1
- 73 Barham Ave
- 40 Clement Terrace
- 25 Evelyn Place
- 271 Holbrook Rd Unit 1
Your Personal Tour Guide
Ask me questions while you tour the home.