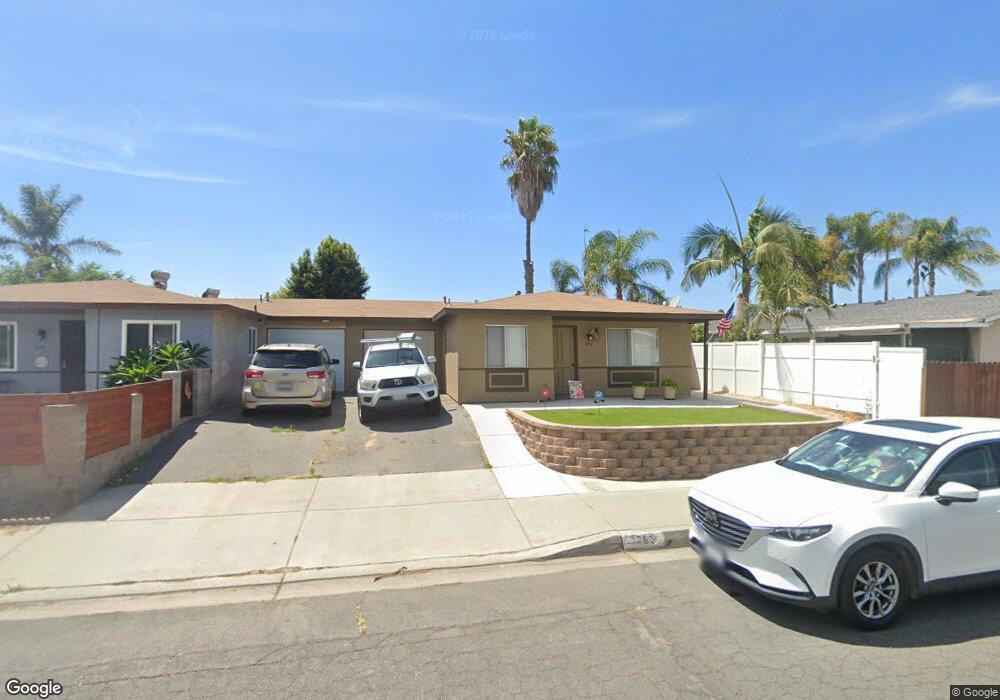
293 Lustrosos St Oceanside, CA 92057
North Valley NeighborhoodEstimated Value: $558,000 - $597,000
2
Beds
1
Bath
827
Sq Ft
$695/Sq Ft
Est. Value
About This Home
This home is located at 293 Lustrosos St, Oceanside, CA 92057 and is currently estimated at $574,872, approximately $695 per square foot. 293 Lustrosos St is a home located in San Diego County with nearby schools including Reynolds Elementary School, Martin Luther King Jr. Middle School, and El Camino High School.
Ownership History
Date
Name
Owned For
Owner Type
Purchase Details
Closed on
Aug 8, 2016
Sold by
Grigsby Demetria Lavon
Bought by
Thomas Timothy D
Current Estimated Value
Home Financials for this Owner
Home Financials are based on the most recent Mortgage that was taken out on this home.
Original Mortgage
$200,000
Outstanding Balance
$159,577
Interest Rate
3.48%
Mortgage Type
New Conventional
Estimated Equity
$415,295
Purchase Details
Closed on
Dec 8, 2015
Sold by
Bowie David Everett and Bowie David E
Bought by
Bowie David Everett and Grigsby Demetria Levon
Purchase Details
Closed on
Jun 27, 2001
Sold by
Wagner Isabel
Bought by
Bowie David E
Home Financials for this Owner
Home Financials are based on the most recent Mortgage that was taken out on this home.
Original Mortgage
$127,991
Interest Rate
7.21%
Mortgage Type
FHA
Create a Home Valuation Report for This Property
The Home Valuation Report is an in-depth analysis detailing your home's value as well as a comparison with similar homes in the area
Home Values in the Area
Average Home Value in this Area
Purchase History
| Date | Buyer | Sale Price | Title Company |
|---|---|---|---|
| Thomas Timothy D | $250,000 | Title 365 | |
| Bowie David Everett | -- | Any Title Company | |
| Bowie David E | $130,000 | New Century Title Company |
Source: Public Records
Mortgage History
| Date | Status | Borrower | Loan Amount |
|---|---|---|---|
| Open | Thomas Timothy D | $200,000 | |
| Previous Owner | Bowie David E | $127,991 | |
| Closed | Bowie David E | $6,200 |
Source: Public Records
Tax History
| Year | Tax Paid | Tax Assessment Tax Assessment Total Assessment is a certain percentage of the fair market value that is determined by local assessors to be the total taxable value of land and additions on the property. | Land | Improvement |
|---|---|---|---|---|
| 2025 | $3,232 | $290,140 | $178,549 | $111,591 |
| 2024 | $3,232 | $284,452 | $175,049 | $109,403 |
| 2023 | $3,132 | $278,875 | $171,617 | $107,258 |
| 2022 | $3,085 | $273,407 | $168,252 | $105,155 |
| 2021 | $3,097 | $268,047 | $164,953 | $103,094 |
| 2020 | $3,002 | $265,299 | $163,262 | $102,037 |
| 2019 | $2,916 | $260,098 | $160,061 | $100,037 |
| 2018 | $2,885 | $254,999 | $156,923 | $98,076 |
| 2017 | $71 | $250,000 | $153,847 | $96,153 |
| 2016 | $1,752 | $162,220 | $99,828 | $62,392 |
| 2015 | $1,701 | $159,784 | $98,329 | $61,455 |
| 2014 | $1,635 | $156,655 | $96,403 | $60,252 |
Source: Public Records
Map
Nearby Homes
- 514 Calle Montecito Unit 78
- 517 Calle Montecito Unit 91
- 525 Calle Montecito Unit 122
- 518 Calle Montecito Unit 95
- 522 Calle Montecito Unit 114
- 4655 Caneel Bay Ct
- 354 Lustrosos St
- 4745 Marblehead Bay Dr
- 265 Securidad St
- 4781 Calle Las Positas
- 397 Moonstone Bay Dr
- 4924 Verde Dr
- 4621 Avery St
- 4660 N River Rd Unit 150
- 4660 N River Rd Unit 116
- 4660 N River Rd Unit 136
- 4660 N River Rd Unit 17
- 4798 Calle Los Santos
- 4616 N River Rd Unit 89
- 4616 N River Rd Unit 8
- 291 Lustrosos St
- 4671 Calle Del Palo
- 4673 Calle Del Palo
- 289 Lustrosos St
- 4669 Calle Del Palo Unit 4
- 340 Avenida Descanso
- 287 Lustrosos St
- 4667 Calle Del Palo
- 338 Avenida Descanso
- 342 Avenida Descanso
- 292 Lustrosos St
- 290 Lustrosos St
- 294 Lustrosos St
- 285 Lustrosos St
- 4665 Calle Del Palo
- 288 Lustrosos St
- 296 Lustrosos St
- 286 Lustrosos St
- 336 Avenida Descanso
- 298 Lustrosos St
Your Personal Tour Guide
Ask me questions while you tour the home.