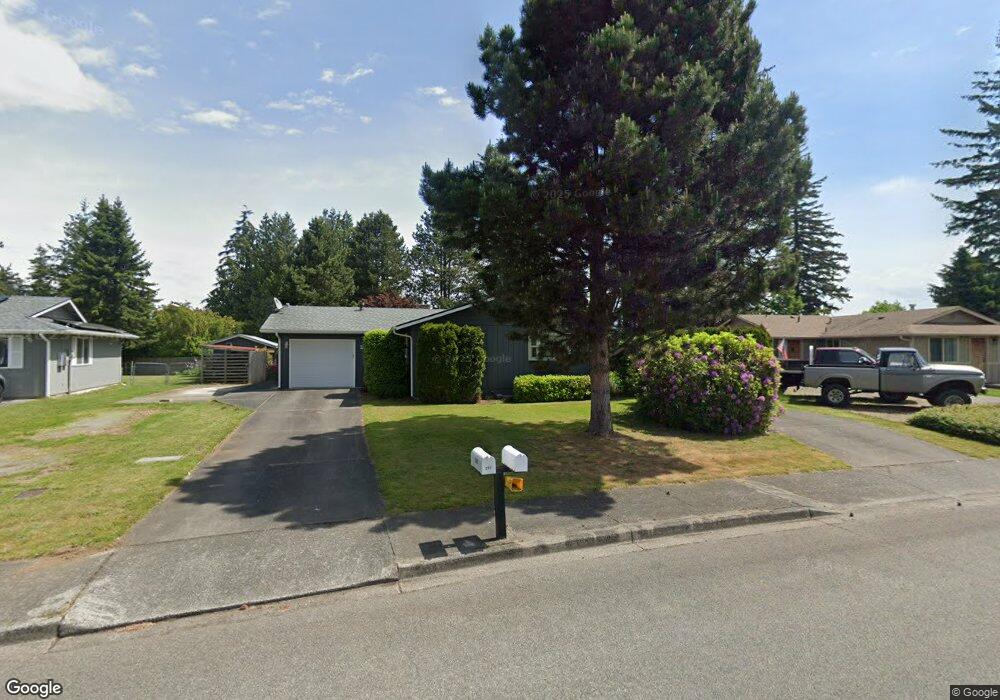
293 Pollman Cir Lynden, WA 98264
Estimated Value: $465,000 - $512,000
3
Beds
1
Bath
1,048
Sq Ft
$461/Sq Ft
Est. Value
About This Home
This home is located at 293 Pollman Cir, Lynden, WA 98264 and is currently estimated at $482,711, approximately $460 per square foot. 293 Pollman Cir is a home located in Whatcom County with nearby schools including Irene Reither Elementary School, Meridian Middle School, and Meridian High School.
Ownership History
Date
Name
Owned For
Owner Type
Purchase Details
Closed on
Feb 2, 1999
Sold by
Vogan Leonard B and Vogan Cheryl
Bought by
Collier Larry R
Current Estimated Value
Home Financials for this Owner
Home Financials are based on the most recent Mortgage that was taken out on this home.
Original Mortgage
$84,550
Outstanding Balance
$19,995
Interest Rate
6.73%
Estimated Equity
$462,716
Create a Home Valuation Report for This Property
The Home Valuation Report is an in-depth analysis detailing your home's value as well as a comparison with similar homes in the area
Home Values in the Area
Average Home Value in this Area
Purchase History
| Date | Buyer | Sale Price | Title Company |
|---|---|---|---|
| Collier Larry R | $89,000 | Chicago Title Insurance Co |
Source: Public Records
Mortgage History
| Date | Status | Borrower | Loan Amount |
|---|---|---|---|
| Open | Collier Larry R | $84,550 |
Source: Public Records
Tax History Compared to Growth
Tax History
| Year | Tax Paid | Tax Assessment Tax Assessment Total Assessment is a certain percentage of the fair market value that is determined by local assessors to be the total taxable value of land and additions on the property. | Land | Improvement |
|---|---|---|---|---|
| 2024 | $3,527 | $455,065 | $218,250 | $236,815 |
| 2023 | $3,527 | $452,707 | $225,000 | $227,707 |
| 2022 | $3,228 | $388,420 | $162,045 | $226,375 |
| 2021 | $3,152 | $321,005 | $133,920 | $187,085 |
| 2020 | $2,818 | $286,618 | $119,574 | $167,044 |
| 2019 | $2,469 | $256,955 | $107,199 | $149,756 |
| 2018 | $2,843 | $246,168 | $102,699 | $143,469 |
| 2017 | $2,605 | $215,729 | $90,000 | $125,729 |
| 2016 | $2,384 | $209,245 | $78,325 | $130,920 |
| 2015 | $2,297 | $190,512 | $72,475 | $118,037 |
| 2014 | -- | $177,981 | $67,275 | $110,706 |
| 2013 | -- | $169,736 | $65,000 | $104,736 |
Source: Public Records
Map
Nearby Homes
- 6852 Dutch Haven Dr
- 6830 Vail Dr
- 6818 Vail Dr
- 0 Old Guide Rd
- 7062 Guide Meridian Rd Unit 26
- 271 E Bartlett Rd
- 6864 Blumefield Dr
- 361 W Wiser Lake Rd
- 6812 Golf View Dr Unit A
- 6917 Red Ridge Dr
- 6037 Old Guide Rd
- 7025 Hannegan Rd
- 918 Citadel Dr
- 6978 Hannegan Rd
- 787 E Wiser Lake Rd
- 765 van Dyk Rd
- 490 W Laurel Rd
- 7343 Hannegan Rd Unit 2
- 1257 Lattimore Rd
- 197 Bay Lyn Dr
- 291 Pollman Cir
- 295 Pollman Cir
- 289 Pollman Cir
- 297 Pollman Cir
- 205 W Pole Rd
- 290 Pollman Cir
- 211 W Pole Rd
- 299 Pollman Cir
- 197 W Pole Rd
- 287 Pollman Cir
- 6861 Braker Way
- 6874 Vail Dr
- 191 W Pole Rd
- 301 Pollman Cir
- 6879 Vail Dr
- 285 Pollman Cir
- 175 W Pole Rd
- 6855 Braker Way
- 303 Pollman Cir
- 6868 Vail Dr