
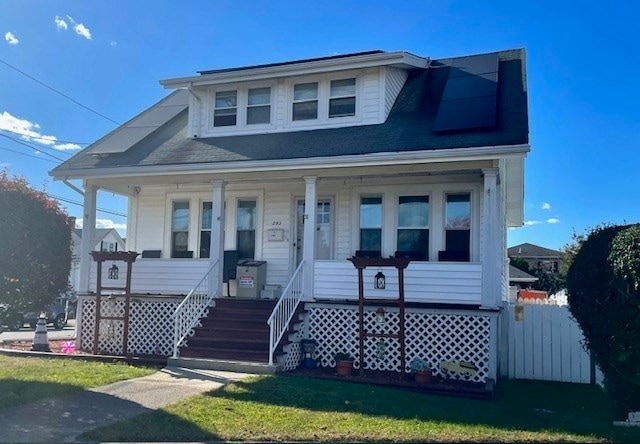


293 Rockdale Ave New Bedford, MA 02740
The South End Neighborhood
2
Beds
1.5
Baths
1,193
Sq Ft
5,423
Sq Ft Lot
Highlights
- Marina
- Medical Services
- Property is near public transit
- Golf Course Community
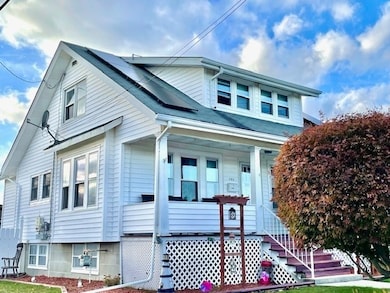
- Cape Cod Architecture
- Wood Flooring
About This Home
As of March 2025Conveniently located Minutes from the MBTA train station, This 7 room home has lots of charm and character !! Featuring a 2-3 Bedroom, 1.5 Bath "Cape" just a short drive to New Bedford's Harbor and scenic beaches. Granite and Hardwoods throughout, The Solar panels make this property an eco-friendly and cost-effective choice, reducing your energy bills year-round. With everything you need for modern living . Large fenced in yard for your summer outdoor entertaining. !!! Come make this your new home. Close to Shopping and transportation. Easy to show! Schedule your private showing before its gone!
Last Buyer's Agent
Melanie Frates
RE/MAX Vantage
Home Details
Home Type
- Single Family
Est. Annual Taxes
- $3,515
Year Built
- Built in 1919
Lot Details
- 5,423 Sq Ft Lot
- Corner Lot
- Irregular Lot
- Property is zoned RB
Parking
- 2 Car Detached Garage
- Off-Street Parking
Home Design
- Cape Cod Architecture
Interior Spaces
- 1,193 Sq Ft Home
- Wood Flooring
- Partially Finished Basement
Bedrooms and Bathrooms
- 2 Bedrooms
Utilities
- No Cooling
- Heating System Uses Natural Gas
- Baseboard Heating
- 220 Volts
- Gas Water Heater
Additional Features
- Solar Water Heater
- Property is near public transit
Listing and Financial Details
- Assessor Parcel Number M:0026 L:0035,2886337
Community Details
Recreation
- Marina
- Golf Course Community
- Park
- Jogging Path
Additional Features
- No Home Owners Association
- Medical Services
Ownership History
Date
Name
Owned For
Owner Type
Purchase Details
Listed on
Oct 9, 2013
Closed on
Apr 9, 2014
Sold by
Leal Christine
Bought by
C Mota Rt
Seller's Agent
James Ricker
Amaral & Associates RE
Buyer's Agent
Elizabeth Silva
Silva Realty Group, Inc.
List Price
$97,000
Sold Price
$125,000
Premium/Discount to List
$28,000
28.87%
Current Estimated Value
Home Financials for this Owner
Home Financials are based on the most recent Mortgage that was taken out on this home.
Estimated Appreciation
$252,118
Avg. Annual Appreciation
10.32%
Purchase Details
Closed on
Jan 30, 2014
Sold by
Melo Tati and Bank New York Mellon T
Bought by
Bank New York Mellon T
Purchase Details
Closed on
Jun 17, 2003
Sold by
Britton Bryan L
Bought by
Perry Jeffrey and Melo Tati
Purchase Details
Closed on
Feb 3, 1997
Sold by
Rose Matthew T
Bought by
Britton Bryan L
Purchase Details
Closed on
May 15, 1990
Sold by
Oliver Mary F Est
Bought by
Rose Matthew T
Similar Homes in New Bedford, MA
Create a Home Valuation Report for This Property
The Home Valuation Report is an in-depth analysis detailing your home's value as well as a comparison with similar homes in the area
Home Values in the Area
Average Home Value in this Area
Purchase History
| Date | Type | Sale Price | Title Company |
|---|---|---|---|
| Deed | -- | -- | |
| Foreclosure Deed | $119,000 | -- | |
| Foreclosure Deed | $119,000 | -- | |
| Deed | $183,000 | -- | |
| Deed | $183,000 | -- | |
| Deed | $90,000 | -- | |
| Deed | $90,000 | -- | |
| Deed | $95,000 | -- |
Source: Public Records
Mortgage History
| Date | Status | Loan Amount | Loan Type |
|---|---|---|---|
| Open | $279,750 | Purchase Money Mortgage | |
| Closed | $279,750 | Purchase Money Mortgage | |
| Closed | $162,011 | FHA | |
| Previous Owner | $200,000 | No Value Available |
Source: Public Records
Property History
| Date | Event | Price | Change | Sq Ft Price |
|---|---|---|---|---|
| 03/17/2025 03/17/25 | Sold | $373,000 | -3.1% | $313 / Sq Ft |
| 02/12/2025 02/12/25 | Pending | -- | -- | -- |
| 01/29/2025 01/29/25 | Price Changed | $384,900 | -2.5% | $323 / Sq Ft |
| 01/09/2025 01/09/25 | Price Changed | $394,900 | -1.3% | $331 / Sq Ft |
| 11/19/2024 11/19/24 | Price Changed | $399,900 | -2.4% | $335 / Sq Ft |
| 11/07/2024 11/07/24 | For Sale | $409,900 | +148.4% | $344 / Sq Ft |
| 04/10/2015 04/10/15 | Sold | $165,000 | 0.0% | $135 / Sq Ft |
| 04/06/2015 04/06/15 | Pending | -- | -- | -- |
| 03/09/2015 03/09/15 | Off Market | $165,000 | -- | -- |
| 02/10/2015 02/10/15 | Price Changed | $169,000 | -0.5% | $138 / Sq Ft |
| 02/08/2015 02/08/15 | Price Changed | $169,900 | 0.0% | $139 / Sq Ft |
| 02/08/2015 02/08/15 | For Sale | $169,900 | +3.0% | $139 / Sq Ft |
| 01/31/2015 01/31/15 | Off Market | $165,000 | -- | -- |
| 01/09/2015 01/09/15 | Price Changed | $174,000 | -2.8% | $142 / Sq Ft |
| 12/17/2014 12/17/14 | For Sale | $179,000 | +13.7% | $146 / Sq Ft |
| 08/28/2014 08/28/14 | Sold | $157,500 | -21.2% | $129 / Sq Ft |
| 07/22/2014 07/22/14 | Pending | -- | -- | -- |
| 04/13/2014 04/13/14 | For Sale | $199,900 | +59.9% | $163 / Sq Ft |
| 04/09/2014 04/09/14 | Sold | $125,000 | 0.0% | $102 / Sq Ft |
| 03/10/2014 03/10/14 | Pending | -- | -- | -- |
| 03/04/2014 03/04/14 | Off Market | $125,000 | -- | -- |
| 02/28/2014 02/28/14 | Price Changed | $97,000 | 0.0% | $79 / Sq Ft |
| 02/28/2014 02/28/14 | For Sale | $97,000 | -22.4% | $79 / Sq Ft |
| 10/23/2013 10/23/13 | Pending | -- | -- | -- |
| 10/15/2013 10/15/13 | Off Market | $125,000 | -- | -- |
| 10/09/2013 10/09/13 | For Sale | $105,000 | -- | $86 / Sq Ft |
Source: MLS Property Information Network (MLS PIN)
Tax History Compared to Growth
Tax History
| Year | Tax Paid | Tax Assessment Tax Assessment Total Assessment is a certain percentage of the fair market value that is determined by local assessors to be the total taxable value of land and additions on the property. | Land | Improvement |
|---|---|---|---|---|
| 2025 | $3,866 | $341,800 | $107,200 | $234,600 |
| 2024 | $3,515 | $292,900 | $109,000 | $183,900 |
| 2023 | $3,695 | $258,600 | $94,000 | $164,600 |
| 2022 | $3,371 | $220,900 | $89,400 | $131,500 |
| 2021 | $14,865 | $216,200 | $89,400 | $126,800 |
| 2020 | $5,081 | $209,700 | $89,400 | $120,300 |
| 2019 | $3,273 | $198,700 | $89,400 | $109,300 |
| 2018 | $3,133 | $188,400 | $89,400 | $99,000 |
| 2017 | $3,003 | $179,900 | $89,400 | $90,500 |
| 2016 | $2,879 | $174,600 | $89,400 | $85,200 |
| 2015 | $2,816 | $179,000 | $89,400 | $89,600 |
| 2014 | $2,582 | $170,300 | $84,000 | $86,300 |
Source: Public Records
Agents Affiliated with this Home
-
Kevin Proulx
K
Seller's Agent in 2025
Kevin Proulx
Amaral & Associates RE
(508) 989-1444
1 in this area
36 Total Sales
-
M
Buyer's Agent in 2025
Melanie Frates
RE/MAX
-
Martin Correia
Seller's Agent in 2015
Martin Correia
ERA The Castelo Group
(508) 995-9294
13 in this area
47 Total Sales
-
Mario Raposo
Buyer's Agent in 2015
Mario Raposo
Majestic Real Estate
(774) 365-1176
1 Total Sale
-
E
Seller's Agent in 2014
Elizabeth Silva
RE/MAX Spectrum of Osterville (INACTIVE)
-
J
Seller's Agent in 2014
James Ricker
Amaral & Associates RE
Map
Source: MLS Property Information Network (MLS PIN)
MLS Number: 73308574
APN: NEWB-000026-000000-000035
Disclaimer: Certain information contained herein is derived from information provided by parties other than Homes.com. All information provided is deemed reliable, but is not guaranteed to be accurate and should be independently verified.
![]() The property listing data and information, or the Images, set forth herein were provided to MLS Property Information Network, Inc. from third party sources, including sellers, lessors and public records, and were compiled by MLS Property Information Network, Inc. The property listing data and information, and the Images, are for the personal, non-commercial use of consumers having a good faith interest in purchasing or leasing listed properties of the type displayed to them and may not be used for any purpose other than to identify prospective properties which such consumers may have a good faith interest in purchasing or leasing. MLS Property Information Network, Inc. and its subscribers disclaim any and all representations and warranties as to the accuracy of the property listing data and information, or as to the accuracy of any of the Images, set forth herein.
The property listing data and information, or the Images, set forth herein were provided to MLS Property Information Network, Inc. from third party sources, including sellers, lessors and public records, and were compiled by MLS Property Information Network, Inc. The property listing data and information, and the Images, are for the personal, non-commercial use of consumers having a good faith interest in purchasing or leasing listed properties of the type displayed to them and may not be used for any purpose other than to identify prospective properties which such consumers may have a good faith interest in purchasing or leasing. MLS Property Information Network, Inc. and its subscribers disclaim any and all representations and warranties as to the accuracy of the property listing data and information, or as to the accuracy of any of the Images, set forth herein.
Nearby Homes