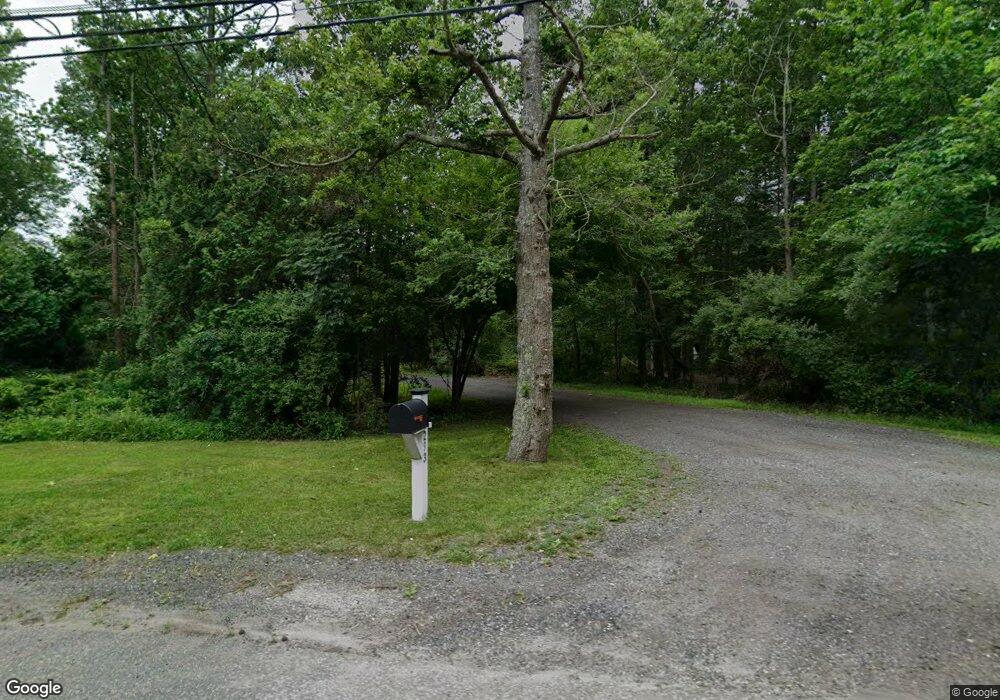
293 Squankum Yellowbrook Rd Farmingdale, NJ 07727
East Howell NeighborhoodEstimated Value: $805,657 - $876,000
3
Beds
2
Baths
2,516
Sq Ft
$333/Sq Ft
Est. Value
About This Home
This home is located at 293 Squankum Yellowbrook Rd, Farmingdale, NJ 07727 and is currently estimated at $836,664, approximately $332 per square foot. 293 Squankum Yellowbrook Rd is a home located in Monmouth County with nearby schools including Ardena School, Adelphia Elementary School, and Howell Middle School North.
Ownership History
Date
Name
Owned For
Owner Type
Purchase Details
Closed on
Apr 18, 2012
Sold by
Capoano Gregory M and Capoano Barbara D
Bought by
Capoano Barbara D
Current Estimated Value
Purchase Details
Closed on
Sep 17, 2010
Sold by
Capoano Gregory M and Capoano Barbara D
Bought by
Capoano Gregory M and Grasso Michael
Purchase Details
Closed on
Apr 17, 2009
Sold by
Grasso Margaret
Bought by
Grasso Michael and Grasso Gina
Create a Home Valuation Report for This Property
The Home Valuation Report is an in-depth analysis detailing your home's value as well as a comparison with similar homes in the area
Home Values in the Area
Average Home Value in this Area
Purchase History
| Date | Buyer | Sale Price | Title Company |
|---|---|---|---|
| Capoano Barbara D | -- | None Available | |
| Capoano Gregory M | -- | None Available | |
| Grasso Michael | -- | None Available |
Source: Public Records
Tax History Compared to Growth
Tax History
| Year | Tax Paid | Tax Assessment Tax Assessment Total Assessment is a certain percentage of the fair market value that is determined by local assessors to be the total taxable value of land and additions on the property. | Land | Improvement |
|---|---|---|---|---|
| 2025 | $12,172 | $666,700 | $305,800 | $360,900 |
| 2024 | $11,728 | $610,100 | $255,800 | $354,300 |
| 2023 | $11,728 | $559,800 | $213,800 | $346,000 |
| 2022 | $11,278 | $510,300 | $180,800 | $329,500 |
| 2021 | $11,278 | $451,900 | $180,800 | $271,100 |
| 2020 | $10,936 | $433,800 | $165,800 | $268,000 |
| 2019 | $10,975 | $429,200 | $165,800 | $263,400 |
| 2018 | $10,738 | $417,000 | $165,800 | $251,200 |
| 2017 | $10,776 | $414,300 | $170,800 | $243,500 |
| 2016 | $10,571 | $402,700 | $145,800 | $256,900 |
| 2015 | $10,584 | $396,100 | $145,800 | $250,300 |
| 2014 | $10,173 | $353,600 | $154,700 | $198,900 |
Source: Public Records
Map
Nearby Homes
- 2 Daybreak Ct
- 4 Daybreak Ct
- 301 Squankum Yellowbrook Rd
- 199 Squankum Yellowbrook Rd
- 1 Daybreak Ct
- 6 Daybreak Ct
- 307 Squankum Yellowbrook Rd
- 8 Daybreak Ct
- 313 Squankum Yellowbrook Rd
- 2 Jordan Ct
- 2 Bridgewater Way
- 3 Bridgewater Way
- 7 Daybreak Ct
- 9 Daybreak Ct
- 5 Bridgewater Way
- 321 Squankum Yellowbrook Rd
- 1 Jordan Ct
- 11 Daybreak Ct
- 7 Bridgewater Way
- 2 Littlefield Dr