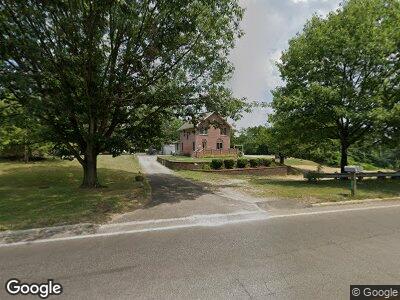
2930 Innis Rd Columbus, OH 43224
Walnut Creek NeighborhoodEstimated Value: $281,945 - $403,000
3
Beds
2
Baths
1,869
Sq Ft
$173/Sq Ft
Est. Value
About This Home
This home is located at 2930 Innis Rd, Columbus, OH 43224 and is currently estimated at $322,736, approximately $172 per square foot. 2930 Innis Rd is a home located in Franklin County with nearby schools including Innis Elementary School, Mifflin Middle School, and Mifflin High School.
Ownership History
Date
Name
Owned For
Owner Type
Purchase Details
Closed on
Feb 18, 1994
Bought by
Radabaugh Julie A
Current Estimated Value
Purchase Details
Closed on
Jan 1, 1987
Create a Home Valuation Report for This Property
The Home Valuation Report is an in-depth analysis detailing your home's value as well as a comparison with similar homes in the area
Home Values in the Area
Average Home Value in this Area
Purchase History
| Date | Buyer | Sale Price | Title Company |
|---|---|---|---|
| Radabaugh Julie A | $60,000 | -- | |
| -- | -- | -- |
Source: Public Records
Mortgage History
| Date | Status | Borrower | Loan Amount |
|---|---|---|---|
| Open | Radabaugh Julie A | $35,000 | |
| Closed | Radabaugh Julie A | $71,000 | |
| Closed | Radabaugh Julie A | $72,000 | |
| Closed | Radabuagh Julie A | $9,000 | |
| Closed | Radabaugh Charles E | $13,500 | |
| Closed | Radabaugh Charles E | $74,250 | |
| Closed | Radabaugh Julie A | $11,402 |
Source: Public Records
Tax History Compared to Growth
Tax History
| Year | Tax Paid | Tax Assessment Tax Assessment Total Assessment is a certain percentage of the fair market value that is determined by local assessors to be the total taxable value of land and additions on the property. | Land | Improvement |
|---|---|---|---|---|
| 2024 | $3,660 | $81,550 | $11,200 | $70,350 |
| 2023 | $3,613 | $81,550 | $11,200 | $70,350 |
| 2022 | $4,245 | $54,530 | $11,200 | $43,330 |
| 2021 | $2,833 | $54,530 | $11,200 | $43,330 |
| 2020 | $2,837 | $54,530 | $11,200 | $43,330 |
| 2019 | $2,610 | $43,020 | $8,960 | $34,060 |
| 2018 | $2,210 | $43,020 | $8,960 | $34,060 |
| 2017 | $2,608 | $43,020 | $8,960 | $34,060 |
| 2016 | $1,999 | $30,180 | $6,900 | $23,280 |
| 2015 | $1,815 | $30,180 | $6,900 | $23,280 |
| 2014 | $1,819 | $30,180 | $6,900 | $23,280 |
| 2013 | $1,055 | $35,490 | $8,120 | $27,370 |
Source: Public Records
Map
Nearby Homes
- 3484 Sweetday St
- 3310 Framington Dr
- 2525 Dexham Ct
- 3126 Dedham St
- 3497 Hillcreek Ct
- 3057 McCutcheon Crossing Dr
- 2495 Hingham Ln
- 4165 Sunbury Rd
- 3073 Kola Way
- 3087 Gideon Ln
- 3339 Crossing Hill Way
- 3183 Gideon Ln
- 2322 Mecca Rd
- 3394 McCutcheon Crossing Dr
- 2520 Mccutcheon Rd
- 2559 Milford Ave
- 2270 Albert Ave
- 2858 Woodland Ave
- 3214 Kenray Dr
- 3106 Caralee Dr