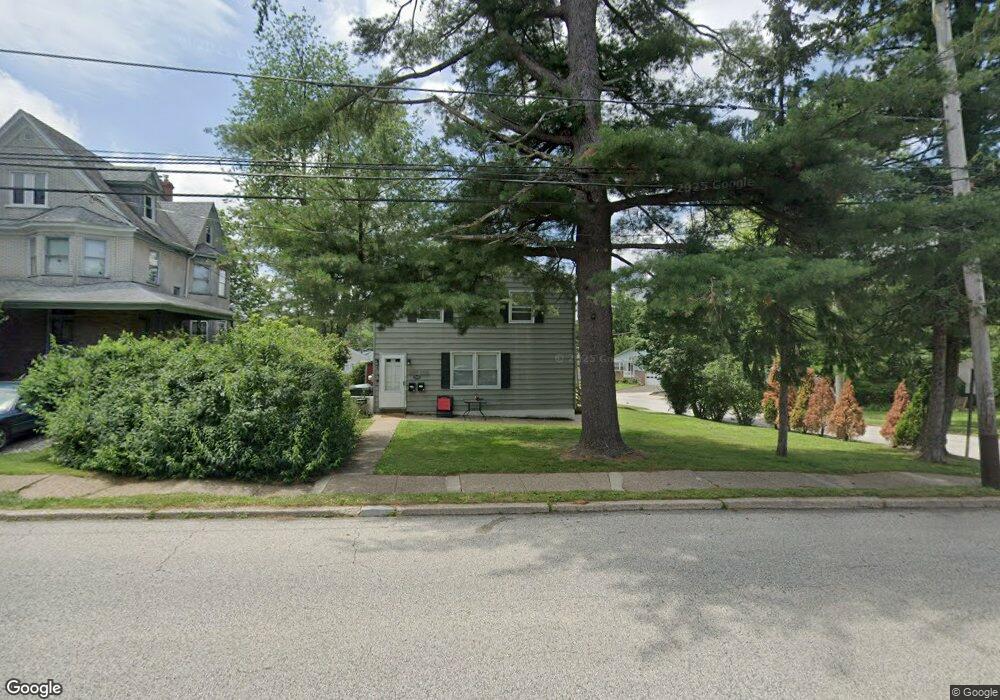
2930 Limekiln Pike Glenside, PA 19038
Estimated Value: $402,000 - $447,616
--
Bed
2
Baths
2,080
Sq Ft
$205/Sq Ft
Est. Value
About This Home
This home is located at 2930 Limekiln Pike, Glenside, PA 19038 and is currently estimated at $426,654, approximately $205 per square foot. 2930 Limekiln Pike is a home located in Montgomery County with nearby schools including Copper Beech Elementary School, Abington Middle School, and Abington Senior High School.
Ownership History
Date
Name
Owned For
Owner Type
Purchase Details
Closed on
Aug 8, 2011
Sold by
Schreiber Randi and Zwilling Randi
Bought by
Kuehl Megan Delany and Kuehl Marybeth
Current Estimated Value
Home Financials for this Owner
Home Financials are based on the most recent Mortgage that was taken out on this home.
Original Mortgage
$217,720
Outstanding Balance
$150,465
Interest Rate
4.53%
Estimated Equity
$276,189
Purchase Details
Closed on
Oct 4, 2006
Sold by
Kim Caris and Kim Hee Don
Bought by
Schreiber Randi
Home Financials for this Owner
Home Financials are based on the most recent Mortgage that was taken out on this home.
Original Mortgage
$263,700
Interest Rate
6.49%
Purchase Details
Closed on
Mar 29, 2004
Sold by
Stewart Mark E
Bought by
Kim Hee D and Kim Caris
Home Financials for this Owner
Home Financials are based on the most recent Mortgage that was taken out on this home.
Original Mortgage
$192,000
Interest Rate
5.58%
Create a Home Valuation Report for This Property
The Home Valuation Report is an in-depth analysis detailing your home's value as well as a comparison with similar homes in the area
Home Values in the Area
Average Home Value in this Area
Purchase History
| Date | Buyer | Sale Price | Title Company |
|---|---|---|---|
| Kuehl Megan Delany | $272,150 | None Available | |
| Schreiber Randi | $293,000 | None Available | |
| Kim Hee D | $242,000 | -- |
Source: Public Records
Mortgage History
| Date | Status | Borrower | Loan Amount |
|---|---|---|---|
| Open | Kuehl Megan Delany | $217,720 | |
| Previous Owner | Schreiber Randi | $263,700 | |
| Previous Owner | Kim Hee D | $192,000 |
Source: Public Records
Tax History Compared to Growth
Tax History
| Year | Tax Paid | Tax Assessment Tax Assessment Total Assessment is a certain percentage of the fair market value that is determined by local assessors to be the total taxable value of land and additions on the property. | Land | Improvement |
|---|---|---|---|---|
| 2025 | $5,885 | $127,070 | $47,460 | $79,610 |
| 2024 | $5,885 | $127,070 | $47,460 | $79,610 |
| 2023 | $5,640 | $127,070 | $47,460 | $79,610 |
| 2022 | $5,458 | $127,070 | $47,460 | $79,610 |
| 2021 | $5,165 | $127,070 | $47,460 | $79,610 |
| 2020 | $5,091 | $127,070 | $47,460 | $79,610 |
| 2019 | $4,862 | $127,070 | $47,460 | $79,610 |
| 2018 | $5,092 | $127,070 | $47,460 | $79,610 |
| 2017 | $4,941 | $127,070 | $47,460 | $79,610 |
| 2016 | $4,892 | $127,070 | $47,460 | $79,610 |
| 2015 | $4,599 | $127,070 | $47,460 | $79,610 |
| 2014 | $4,599 | $127,070 | $47,460 | $79,610 |
Source: Public Records
Map
Nearby Homes
- 245 Linden Ave
- 441 Cricket Ave
- 140 Linden Ave
- 332 Logan Ave
- 0 Girard Ave
- 162 Logan Ave
- 2711 Taft Ave
- 458 Monroe Ave
- 340 Locust Rd
- 550 Penn Ave
- 56 Chelfield Rd
- 110 Girard Ave
- 229 Edge Hill Rd
- 324 Valley Rd
- 0 Logan Ave Unit PAMC2112680
- 642 Monroe Ave
- 116 Twining Rd
- 101 Orlando Ave
- 0 Tyson Ave Unit PAMC2112670
- 65 Limekiln Pike
- 2924 Limekiln Pike
- 163 Tennis Ave
- 2918 Limekiln Pike Unit 36
- 157 Tennis Ave
- 3008 Limekiln Pike
- 204 Tennis Ave
- 2943 Limekiln Pike
- 2912 Limekiln Pike
- 164 Tennis Ave
- 168 Tennis Ave
- 205 Tennis Ave
- 147 Tennis Ave
- 160 Tennis Ave
- 2951 Limekiln Pike
- 156 Tennis Ave
- 3014 Limekiln Pike
- 2927 Limekiln Pike
- 152 Tennis Ave
- 304 Tennis Ave
- 2906 Limekiln Pike