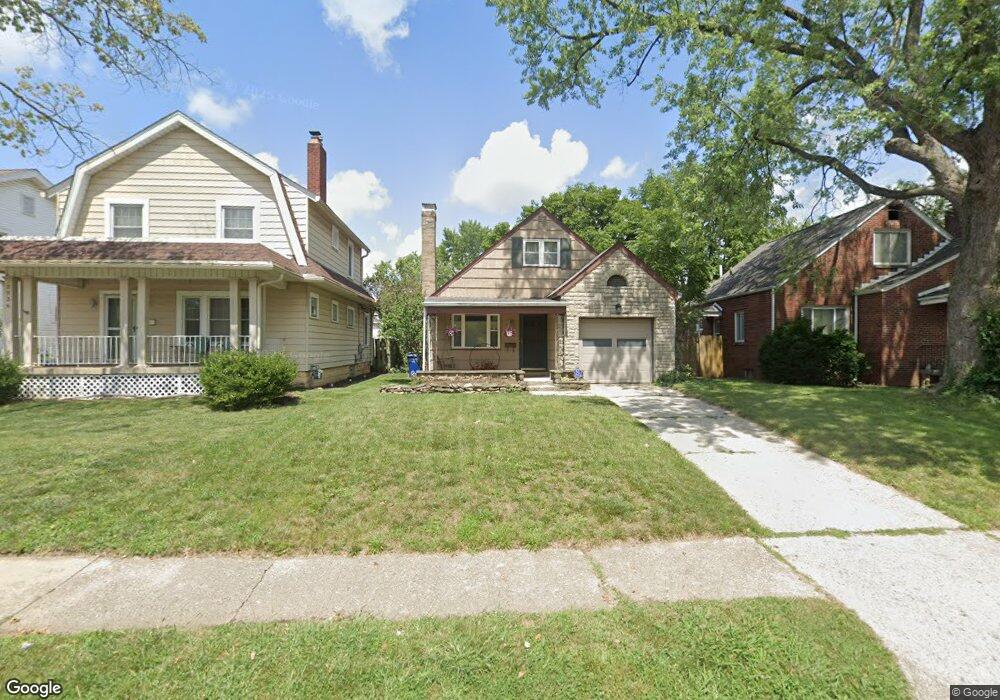
2930 Olive St Columbus, OH 43204
Westgate NeighborhoodEstimated Value: $231,617 - $251,000
3
Beds
3
Baths
1,248
Sq Ft
$193/Sq Ft
Est. Value
About This Home
This home is located at 2930 Olive St, Columbus, OH 43204 and is currently estimated at $241,404, approximately $193 per square foot. 2930 Olive St is a home located in Franklin County with nearby schools including Westgate Alternative Elementary School, Westmoor Middle School, and West High School.
Ownership History
Date
Name
Owned For
Owner Type
Purchase Details
Closed on
Apr 1, 2002
Sold by
Bellas Robert A and Bellas Rachel R
Bought by
Addison Susan P and Addison Robin B
Current Estimated Value
Purchase Details
Closed on
May 7, 1996
Sold by
Spaziano Suzanne K
Bought by
Bellas Robert A and Bellas Rachel R
Home Financials for this Owner
Home Financials are based on the most recent Mortgage that was taken out on this home.
Original Mortgage
$71,677
Outstanding Balance
$2,042
Interest Rate
7.86%
Mortgage Type
FHA
Estimated Equity
$239,362
Purchase Details
Closed on
Dec 29, 1992
Purchase Details
Closed on
Jun 30, 1988
Create a Home Valuation Report for This Property
The Home Valuation Report is an in-depth analysis detailing your home's value as well as a comparison with similar homes in the area
Home Values in the Area
Average Home Value in this Area
Purchase History
| Date | Buyer | Sale Price | Title Company |
|---|---|---|---|
| Addison Susan P | $97,000 | -- | |
| Bellas Robert A | $72,900 | -- | |
| -- | $64,500 | -- | |
| -- | $56,000 | -- |
Source: Public Records
Mortgage History
| Date | Status | Borrower | Loan Amount |
|---|---|---|---|
| Open | Bellas Robert A | $71,677 |
Source: Public Records
Tax History
| Year | Tax Paid | Tax Assessment Tax Assessment Total Assessment is a certain percentage of the fair market value that is determined by local assessors to be the total taxable value of land and additions on the property. | Land | Improvement |
|---|---|---|---|---|
| 2025 | $3,269 | $71,330 | $20,300 | $51,030 |
| 2024 | $3,269 | $71,330 | $20,300 | $51,030 |
| 2023 | $3,228 | $71,330 | $20,300 | $51,030 |
| 2022 | $2,457 | $46,240 | $6,620 | $39,620 |
| 2021 | $2,462 | $46,240 | $6,620 | $39,620 |
| 2020 | $2,465 | $46,240 | $6,620 | $39,620 |
| 2019 | $2,440 | $39,240 | $5,500 | $33,740 |
| 2018 | $2,222 | $39,240 | $5,500 | $33,740 |
| 2017 | $2,329 | $39,240 | $5,500 | $33,740 |
| 2016 | $2,279 | $34,410 | $8,930 | $25,480 |
| 2015 | $2,069 | $34,410 | $8,930 | $25,480 |
| 2014 | $2,074 | $34,410 | $8,930 | $25,480 |
| 2013 | $1,023 | $34,405 | $8,925 | $25,480 |
Source: Public Records
Map
Nearby Homes
- 235 S Roys Ave
- 185 S Huron Ave
- 261 S Chase Ave
- 65 S Hague Ave
- 327 S Chase Ave
- 2845 Fremont St
- 144 S Brinker Ave
- 3096 Ellis Place
- 363 S Chase Ave
- 2710 Palmetto St
- 77 S Brinker Ave
- 89 N Roys Ave
- 75 N Huron Ave
- 262 S Harris Ave
- 107 Haldy Ave
- 271 S Warren Ave
- 3001 Wicklow Rd
- 51 S Ogden Ave Unit 51H
- 361 S Harris Ave Unit 361
- 338-340 S Harris Ave
- 2936 Olive St
- 2936 Olive St Unit Sr
- 2924 Olive St
- 2920 Olive St
- 2916 Olive St
- 2925 Olive St
- 2921 Olive St
- 2915 Olive St
- 2946 Olive St
- 2935 Crescent Dr
- 2941 Crescent Dr
- 2911 Olive St
- 2929 Crescent Dr
- 105 S Roys Ave
- 2949 Crescent Dr
- 2905 Olive St
- 97 S Roys Ave
- 2923 Crescent Dr
- 91 S Roys Ave
- 120 Binns Blvd
Your Personal Tour Guide
Ask me questions while you tour the home.