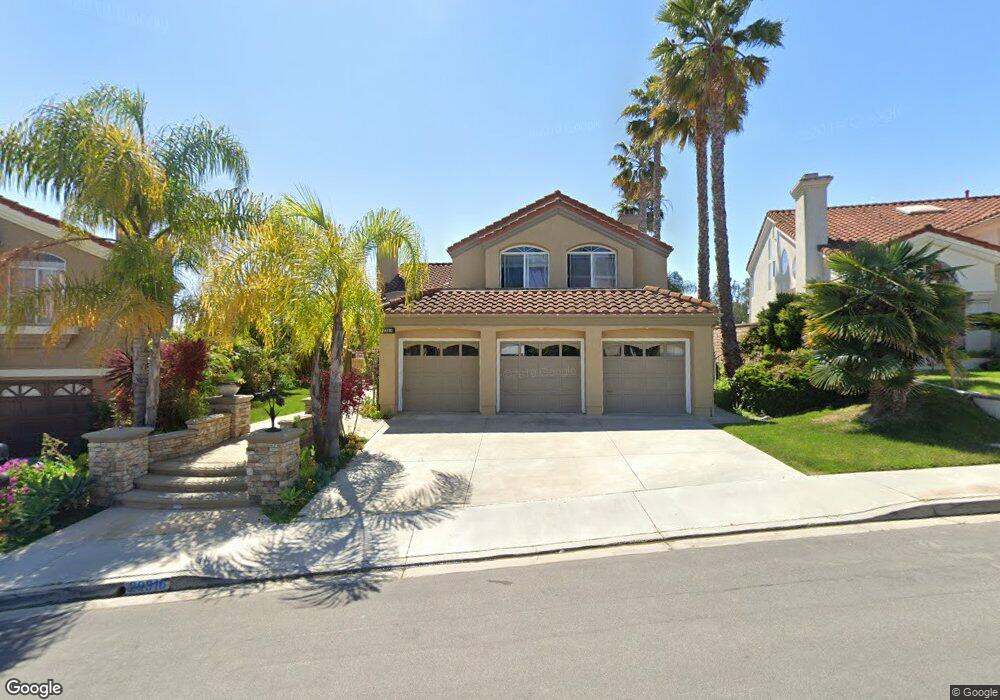
29316 Dean St Laguna Niguel, CA 92677
Estimated Value: $1,863,726 - $2,096,000
4
Beds
3
Baths
2,728
Sq Ft
$728/Sq Ft
Est. Value
About This Home
This home is located at 29316 Dean St, Laguna Niguel, CA 92677 and is currently estimated at $1,984,932, approximately $727 per square foot. 29316 Dean St is a home located in Orange County with nearby schools including Moulton Elementary, Aliso Viejo Middle School, and Aliso Niguel High School.
Ownership History
Date
Name
Owned For
Owner Type
Purchase Details
Closed on
Apr 25, 2022
Sold by
Kasravi Saina
Bought by
Honarkar Kasravi Family Trust
Current Estimated Value
Purchase Details
Closed on
Nov 21, 2005
Sold by
Honarkar Babak
Bought by
Kasravi Saina
Home Financials for this Owner
Home Financials are based on the most recent Mortgage that was taken out on this home.
Original Mortgage
$776,000
Interest Rate
1%
Mortgage Type
Negative Amortization
Purchase Details
Closed on
Nov 15, 2005
Sold by
Vaeches Theodore
Bought by
Kasravi Saina
Home Financials for this Owner
Home Financials are based on the most recent Mortgage that was taken out on this home.
Original Mortgage
$776,000
Interest Rate
1%
Mortgage Type
Negative Amortization
Purchase Details
Closed on
Jul 23, 1998
Sold by
Theodore Vaeches and Theodore Serina
Bought by
Vaeches Theodore and Vaeches Serina
Create a Home Valuation Report for This Property
The Home Valuation Report is an in-depth analysis detailing your home's value as well as a comparison with similar homes in the area
Home Values in the Area
Average Home Value in this Area
Purchase History
| Date | Buyer | Sale Price | Title Company |
|---|---|---|---|
| Honarkar Kasravi Family Trust | -- | -- | |
| Kasravi Saina | -- | Equity Title Company | |
| Kasravi Saina | $970,000 | Equity Title Company | |
| Vaeches Theodore | -- | -- |
Source: Public Records
Mortgage History
| Date | Status | Borrower | Loan Amount |
|---|---|---|---|
| Previous Owner | Kasravi Saina | $776,000 |
Source: Public Records
Tax History Compared to Growth
Tax History
| Year | Tax Paid | Tax Assessment Tax Assessment Total Assessment is a certain percentage of the fair market value that is determined by local assessors to be the total taxable value of land and additions on the property. | Land | Improvement |
|---|---|---|---|---|
| 2025 | $13,095 | $1,325,582 | $947,149 | $378,433 |
| 2024 | $13,095 | $1,299,591 | $928,578 | $371,013 |
| 2023 | $12,816 | $1,274,109 | $910,370 | $363,739 |
| 2022 | $11,997 | $1,192,380 | $892,520 | $299,860 |
| 2021 | $11,765 | $1,169,000 | $875,020 | $293,980 |
| 2020 | $10,670 | $1,060,408 | $767,901 | $292,507 |
| 2019 | $10,459 | $1,039,616 | $752,844 | $286,772 |
| 2018 | $10,463 | $1,039,616 | $752,844 | $286,772 |
| 2017 | $10,464 | $1,039,616 | $752,844 | $286,772 |
| 2016 | $10,468 | $1,039,616 | $752,844 | $286,772 |
| 2015 | $10,310 | $1,024,000 | $741,535 | $282,465 |
| 2014 | $8,967 | $890,947 | $608,482 | $282,465 |
Source: Public Records
Map
Nearby Homes
- 29254 Alfieri St
- 29312 Kensington Dr
- 29486 Pelican Way
- 28891 Drakes Bay
- 29141 Bobolink Dr
- 29494 Port Royal Way
- 29372 Christiana Way Unit 51
- 29712 Ellendale Dr
- 23706 Sea Breeze Ln Unit 1
- 23653 Lexington Ct Unit 2
- 29522 Seriana
- 28661 Point Loma
- 23231 Cheswald Dr
- 7 Sierra Vista
- 29632 Seriana
- 1 O'Hill
- 29931 Happy Sparrow Ln
- 29981 Running Deer Ln
- 30052 Happy Sparrow Ln
- 24306 Hillview Dr
- 29322 Dean St
- 29312 Dean St
- 29326 Dean St
- 29302 Dean St
- 29321 Dean St
- 29311 Dean St
- 29332 Dean St
- 29292 Dean St
- 29306 Alfieri St
- 29291 Dean St
- 29282 Dean St
- 29296 Alfieri St
- 29281 Dean St
- 29286 Alfieri St
- 29346 Dean St
- 29272 Dean St
- 29292 Clipper Way
- 29282 Clipper Way
- 29271 Dean St
- 29312 Clipper Way