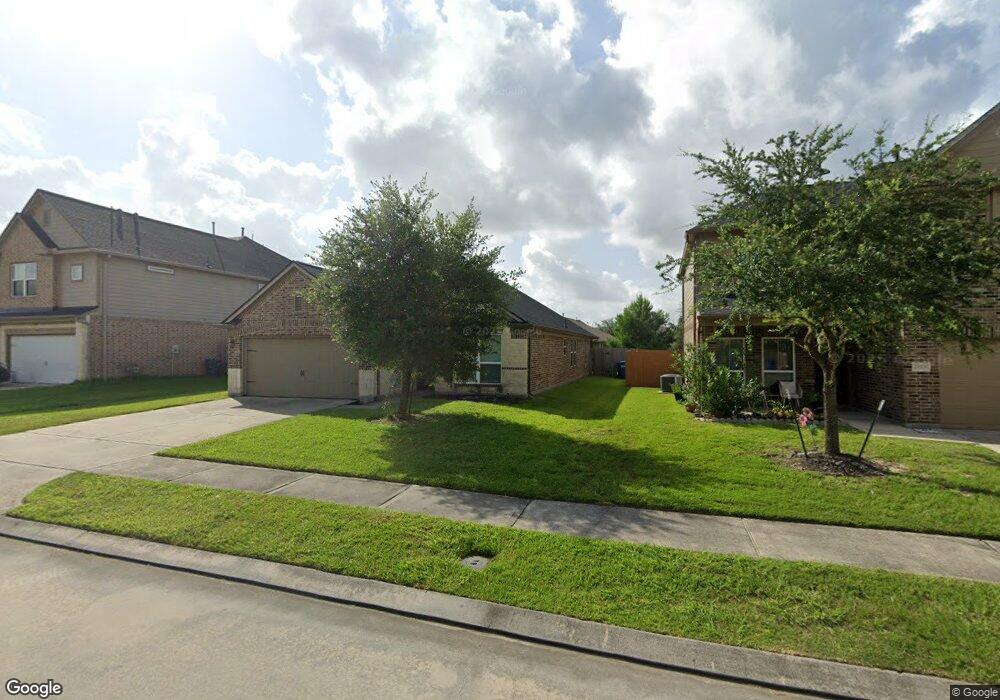
29319 Indian Clearing Trail Spring, TX 77386
Estimated Value: $264,869 - $320,000
3
Beds
2
Baths
1,794
Sq Ft
$161/Sq Ft
Est. Value
About This Home
This home is located at 29319 Indian Clearing Trail, Spring, TX 77386 and is currently estimated at $288,967, approximately $161 per square foot. 29319 Indian Clearing Trail is a home located in Harris County with nearby schools including A. Davis Ford Elementary School, Vogel Intermediate School, and Irons J High School.
Ownership History
Date
Name
Owned For
Owner Type
Purchase Details
Closed on
Jun 4, 2019
Sold by
Maldonado Marisol and Pirozzolo Joseph
Bought by
Davis Nicholas and Davis Shawnta
Current Estimated Value
Home Financials for this Owner
Home Financials are based on the most recent Mortgage that was taken out on this home.
Original Mortgage
$191,468
Outstanding Balance
$168,685
Interest Rate
4.2%
Mortgage Type
FHA
Estimated Equity
$120,282
Purchase Details
Closed on
Mar 27, 2015
Sold by
Long Lake Ltd
Bought by
Maldonado Marisol and Pirozzolo Joseph
Home Financials for this Owner
Home Financials are based on the most recent Mortgage that was taken out on this home.
Original Mortgage
$176,739
Interest Rate
3.73%
Mortgage Type
FHA
Purchase Details
Closed on
Dec 1, 2014
Sold by
Woodmere Development Co Ltd
Bought by
Pirozzolo Joseph and Marisol Maldonado
Create a Home Valuation Report for This Property
The Home Valuation Report is an in-depth analysis detailing your home's value as well as a comparison with similar homes in the area
Home Values in the Area
Average Home Value in this Area
Purchase History
| Date | Buyer | Sale Price | Title Company |
|---|---|---|---|
| Davis Nicholas | -- | None Available | |
| Maldonado Marisol | -- | South Land Title Llc | |
| Pirozzolo Joseph | -- | -- |
Source: Public Records
Mortgage History
| Date | Status | Borrower | Loan Amount |
|---|---|---|---|
| Open | Davis Nicholas | $191,468 | |
| Previous Owner | Maldonado Marisol | $176,739 |
Source: Public Records
Tax History Compared to Growth
Tax History
| Year | Tax Paid | Tax Assessment Tax Assessment Total Assessment is a certain percentage of the fair market value that is determined by local assessors to be the total taxable value of land and additions on the property. | Land | Improvement |
|---|---|---|---|---|
| 2025 | $2,794 | $270,454 | $42,500 | $227,954 |
| 2024 | $2,794 | $253,693 | -- | -- |
| 2023 | $4,072 | $230,630 | $42,500 | $236,920 |
| 2022 | $5,546 | $209,660 | $42,500 | $208,490 |
| 2021 | $5,372 | $190,600 | $42,500 | $148,100 |
| 2020 | $5,298 | $179,960 | $24,060 | $155,900 |
| 2019 | $5,036 | $167,080 | $24,060 | $143,020 |
| 2018 | $3,880 | $155,790 | $24,060 | $131,730 |
| 2017 | $4,692 | $155,790 | $24,060 | $131,730 |
| 2016 | $4,692 | $155,790 | $24,060 | $131,730 |
| 2015 | $183 | $148,050 | $24,060 | $123,990 |
| 2014 | $183 | $6,020 | $6,020 | $0 |
Source: Public Records
Map
Nearby Homes
- 29322 Indian Clearing Trail
- 29314 Nectar Bloom Ct
- 2678 Elm Crossing Trail
- 2551 Elm Crossing Trail
- 2504 Elm Crossing Trail
- 29464 Graceful Path Way
- 29051 Birch Green Way
- 29474 Forest Floor Ln
- 29475 Forest Floor Ln
- 2277 Forest Chestnut Dr
- 2322 Garden Square Path
- 29204 Enchanted Falls Cir
- 2138 Reed Cave Ln
- 29200 Mossbrae Falls Ct
- 1705 Riley Fuzzel C Rd
- 29526 Winton Wood Way
- 29207 Fox Fountain Ln
- 1623 Riley Fuzzel Rd
- 29518 Timber Trail St
- 2511 Leichester Dr
- 29325 Indian Clearing Trail
- 29315 Indian Clearing Trail
- 29331 Indian Clearing Trail
- 29311 Oak Trunnel Ct
- 2615 Magnolia Fair Way
- 29315 Oak Trunnel Ct
- 2619 Magnolia Fair Way
- 29318 Indian Clearing Trail
- 29326 Indian Clearing Trail
- 2623 Magnolia Fair Way
- 29330 Indian Clearing Trail
- 2598 Elm Crossing Trail
- 2606 Elm Crossing Trail
- 2614 Elm Crossing Trail
- 2622 Elm Crossing Trail
- 2606 Magnolia Fair Way
- 2610 Magnolia Fair Way
- 2614 Magnolia Fair Way
- 2598 Magnolia Fair Way
- 2576 Elm Crossing Trail