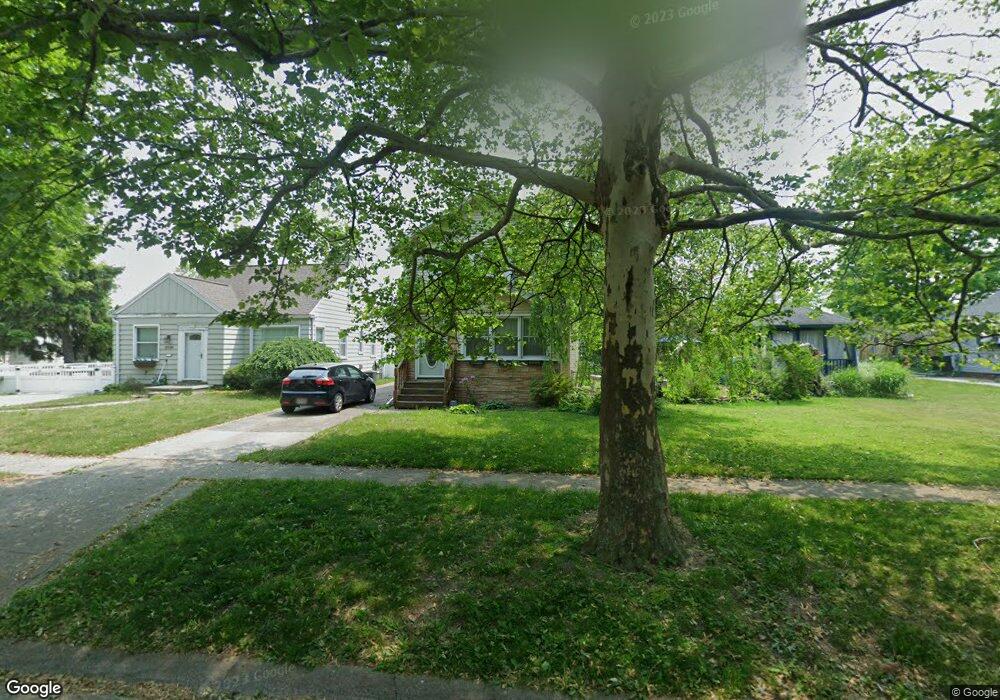
2932 121st St Toledo, OH 43611
Point Place NeighborhoodEstimated Value: $141,000 - $148,317
3
Beds
1
Bath
1,172
Sq Ft
$123/Sq Ft
Est. Value
About This Home
This home is located at 2932 121st St, Toledo, OH 43611 and is currently estimated at $144,079, approximately $122 per square foot. 2932 121st St is a home located in Lucas County with nearby schools including Edgewater Elementary School, Woodward High School, and Imagine Environmental Science Academy.
Ownership History
Date
Name
Owned For
Owner Type
Purchase Details
Closed on
Aug 6, 2004
Sold by
Duwve William E and Duwve Mary K
Bought by
Graham Christopher R and Pilatowski Shannon M
Current Estimated Value
Home Financials for this Owner
Home Financials are based on the most recent Mortgage that was taken out on this home.
Original Mortgage
$87,000
Outstanding Balance
$43,428
Interest Rate
6.1%
Mortgage Type
Purchase Money Mortgage
Estimated Equity
$100,651
Purchase Details
Closed on
Jan 3, 1989
Sold by
Tassell J D and L D
Create a Home Valuation Report for This Property
The Home Valuation Report is an in-depth analysis detailing your home's value as well as a comparison with similar homes in the area
Home Values in the Area
Average Home Value in this Area
Purchase History
| Date | Buyer | Sale Price | Title Company |
|---|---|---|---|
| Graham Christopher R | $87,000 | Northwest Title Agency Of Oh | |
| -- | $45,900 | -- |
Source: Public Records
Mortgage History
| Date | Status | Borrower | Loan Amount |
|---|---|---|---|
| Open | Graham Christopher R | $87,000 |
Source: Public Records
Tax History Compared to Growth
Tax History
| Year | Tax Paid | Tax Assessment Tax Assessment Total Assessment is a certain percentage of the fair market value that is determined by local assessors to be the total taxable value of land and additions on the property. | Land | Improvement |
|---|---|---|---|---|
| 2024 | $1,135 | $37,590 | $5,215 | $32,375 |
| 2023 | $1,755 | $27,510 | $6,825 | $20,685 |
| 2022 | $1,757 | $27,510 | $6,825 | $20,685 |
| 2021 | $1,799 | $27,510 | $6,825 | $20,685 |
| 2020 | $1,692 | $22,750 | $5,635 | $17,115 |
| 2019 | $1,645 | $22,750 | $5,635 | $17,115 |
| 2018 | $1,560 | $22,750 | $5,635 | $17,115 |
| 2017 | $1,482 | $19,250 | $4,760 | $14,490 |
| 2016 | $1,481 | $55,000 | $13,600 | $41,400 |
| 2015 | $1,468 | $55,000 | $13,600 | $41,400 |
| 2014 | $1,211 | $19,250 | $4,760 | $14,490 |
| 2013 | $1,211 | $19,250 | $4,760 | $14,490 |
Source: Public Records
Map
Nearby Homes