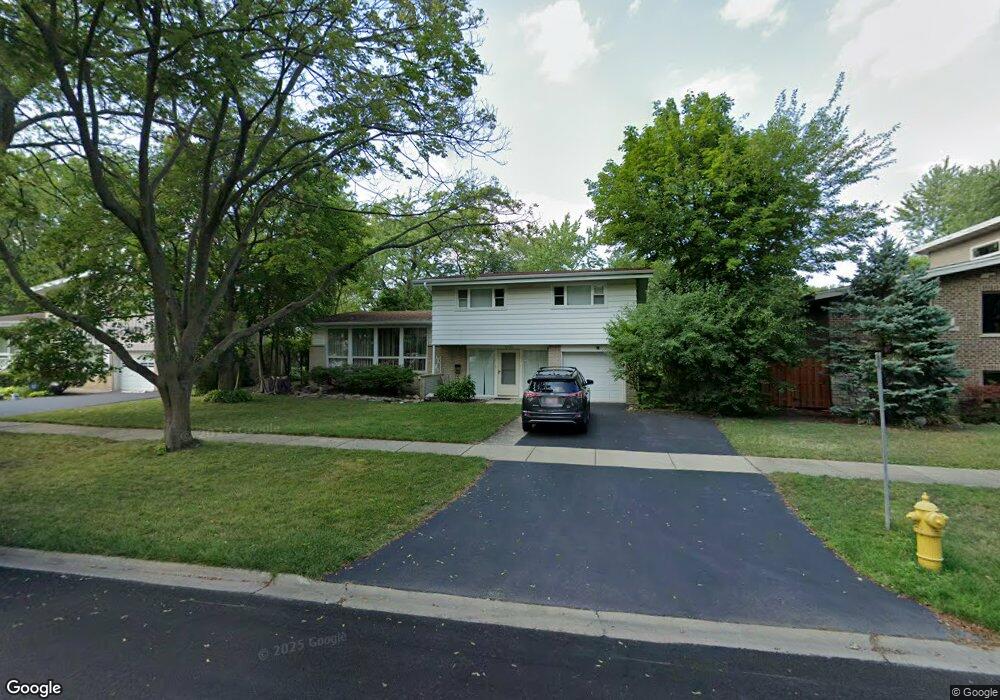
2932 Covert Rd Glenview, IL 60025
Estimated Value: $487,000 - $553,000
4
Beds
3
Baths
1,421
Sq Ft
$364/Sq Ft
Est. Value
About This Home
This home is located at 2932 Covert Rd, Glenview, IL 60025 and is currently estimated at $517,200, approximately $363 per square foot. 2932 Covert Rd is a home located in Cook County with nearby schools including Washington Elementary School, Gemini Middle School, and Maine East High School.
Ownership History
Date
Name
Owned For
Owner Type
Purchase Details
Closed on
Jan 4, 2025
Sold by
Mironchuk Yakov and Mironchuk Yelena
Bought by
Mironchuk Family Revocable Living Trust and Mironchuk
Current Estimated Value
Purchase Details
Closed on
Aug 4, 2004
Sold by
Cheng Roger and Cheng Andy
Bought by
Mironchuk Yakov and Mironchuk Yelena
Home Financials for this Owner
Home Financials are based on the most recent Mortgage that was taken out on this home.
Original Mortgage
$255,000
Interest Rate
5.93%
Mortgage Type
Balloon
Purchase Details
Closed on
Aug 14, 1999
Sold by
Cheng Hong Kuei and Cheng Shioi Ing
Bought by
Cheng Roger and Cheng Andy
Create a Home Valuation Report for This Property
The Home Valuation Report is an in-depth analysis detailing your home's value as well as a comparison with similar homes in the area
Home Values in the Area
Average Home Value in this Area
Purchase History
| Date | Buyer | Sale Price | Title Company |
|---|---|---|---|
| Mironchuk Family Revocable Living Trust | -- | None Listed On Document | |
| Mironchuk Family Revocable Living Trust | -- | None Listed On Document | |
| Mironchuk Yakov | $340,000 | Ticor | |
| Cheng Roger | -- | -- |
Source: Public Records
Mortgage History
| Date | Status | Borrower | Loan Amount |
|---|---|---|---|
| Previous Owner | Mironchuk Yakov | $255,000 |
Source: Public Records
Tax History
| Year | Tax Paid | Tax Assessment Tax Assessment Total Assessment is a certain percentage of the fair market value that is determined by local assessors to be the total taxable value of land and additions on the property. | Land | Improvement |
|---|---|---|---|---|
| 2025 | $6,976 | $43,337 | $12,075 | $31,262 |
| 2024 | $6,976 | $34,201 | $10,143 | $24,058 |
| 2023 | $8,025 | $34,201 | $10,143 | $24,058 |
| 2022 | $8,025 | $37,014 | $10,143 | $26,871 |
| 2021 | $5,747 | $23,504 | $8,694 | $14,810 |
| 2020 | $5,646 | $23,504 | $8,694 | $14,810 |
| 2019 | $6,427 | $29,753 | $8,694 | $21,059 |
| 2018 | $5,945 | $25,462 | $7,486 | $17,976 |
| 2017 | $5,823 | $25,462 | $7,486 | $17,976 |
| 2016 | $6,196 | $27,522 | $7,486 | $20,036 |
| 2015 | $5,734 | $23,672 | $6,279 | $17,393 |
| 2014 | $6,414 | $26,815 | $6,279 | $20,536 |
| 2013 | $6,280 | $26,815 | $6,279 | $20,536 |
Source: Public Records
Map
Nearby Homes
- 9909 N Huber Ln
- 705 Glendale Rd
- 2700 Fontana Dr
- 324 Warren Rd
- 602 Glenshire Rd
- 525 Glenshire Rd
- 9833 N Lauren Ln
- 2537 Pick Dr
- 524 Hazelwood Ln
- 216 Flora Ave
- 606 Greendale Rd
- 3409 Fairlawn Dr Unit B
- 30 Crescent Dr
- 911 Elmdale Rd
- 3505 Linneman St
- 2506 Allison Ct
- 1088 Shermer Rd Unit DW
- 9500 N Washington St Unit 505
- 1028 Highland Ln
- 440 Briarhill Rd
- 2938 Covert Rd
- 2928 Covert Rd
- 2946 Covert Rd
- 2922 Covert Rd
- 2933 Central Rd
- 2937 Central Rd
- 2929 Central Rd
- 2943 Central Rd
- 2950 Covert Rd
- 2916 Covert Rd
- 2923 Central Rd
- 2931 Covert Rd
- 2927 Covert Rd
- 2939 Covert Rd
- 2947 Central Rd
- 2921 Covert Rd
- 2917 Central Rd
- 513 Sheryl Ln
- 2915 Covert Rd
- 2910 Covert Rd
Your Personal Tour Guide
Ask me questions while you tour the home.