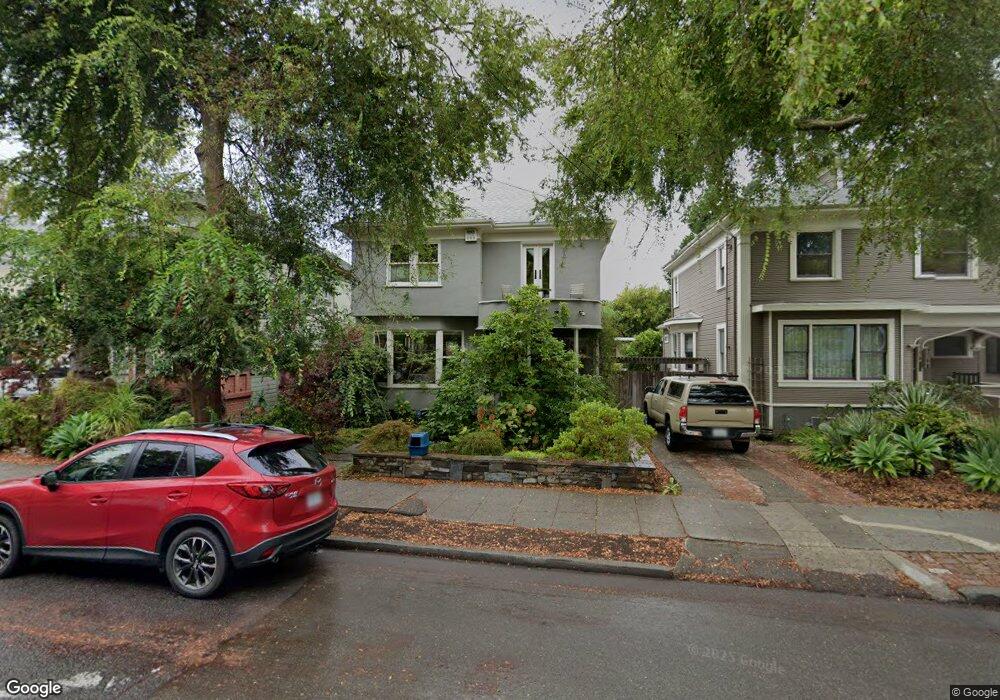
2932 Harper St Berkeley, CA 94703
South Berkeley NeighborhoodEstimated Value: $1,202,000 - $1,431,826
4
Beds
2
Baths
2,189
Sq Ft
$615/Sq Ft
Est. Value
About This Home
This home is located at 2932 Harper St, Berkeley, CA 94703 and is currently estimated at $1,345,457, approximately $614 per square foot. 2932 Harper St is a home located in Alameda County with nearby schools including Malcolm X Elementary School, Emerson Elementary School, and John Muir Elementary School.
Ownership History
Date
Name
Owned For
Owner Type
Purchase Details
Closed on
Aug 20, 2010
Sold by
Frey Douglas M and Frey Amy S
Bought by
Frey Douglas M and Frey Amy S
Current Estimated Value
Home Financials for this Owner
Home Financials are based on the most recent Mortgage that was taken out on this home.
Original Mortgage
$417,000
Outstanding Balance
$275,398
Interest Rate
4.52%
Mortgage Type
New Conventional
Estimated Equity
$1,070,059
Purchase Details
Closed on
Jun 9, 2010
Sold by
Curtis Stephanie Thompson and The Nancy H Thompson Trust
Bought by
Frey Douglas and Stelmach Amy Mckenzie
Home Financials for this Owner
Home Financials are based on the most recent Mortgage that was taken out on this home.
Original Mortgage
$417,000
Interest Rate
4.99%
Mortgage Type
Purchase Money Mortgage
Create a Home Valuation Report for This Property
The Home Valuation Report is an in-depth analysis detailing your home's value as well as a comparison with similar homes in the area
Home Values in the Area
Average Home Value in this Area
Purchase History
| Date | Buyer | Sale Price | Title Company |
|---|---|---|---|
| Frey Douglas M | -- | Old Republic Title Company | |
| Frey Douglas | $602,000 | Old Republic Title Company |
Source: Public Records
Mortgage History
| Date | Status | Borrower | Loan Amount |
|---|---|---|---|
| Open | Frey Douglas M | $417,000 | |
| Closed | Frey Douglas | $417,000 |
Source: Public Records
Tax History
| Year | Tax Paid | Tax Assessment Tax Assessment Total Assessment is a certain percentage of the fair market value that is determined by local assessors to be the total taxable value of land and additions on the property. | Land | Improvement |
|---|---|---|---|---|
| 2025 | $14,127 | $792,984 | $233,105 | $566,879 |
| 2024 | $14,127 | $777,304 | $228,536 | $555,768 |
| 2023 | $13,814 | $768,926 | $224,055 | $544,871 |
| 2022 | $13,517 | $746,853 | $219,663 | $534,190 |
| 2021 | $13,573 | $732,078 | $215,358 | $523,720 |
| 2020 | $12,370 | $731,504 | $213,151 | $518,353 |
| 2019 | $11,510 | $696,573 | $208,972 | $487,601 |
| 2018 | $11,292 | $682,920 | $204,876 | $478,044 |
| 2017 | $10,949 | $669,531 | $200,859 | $468,672 |
| 2016 | $10,181 | $656,408 | $196,922 | $459,486 |
| 2015 | $10,037 | $646,553 | $193,966 | $452,587 |
| 2014 | $9,945 | $633,893 | $190,168 | $443,725 |
Source: Public Records
Map
Nearby Homes
- 2926 Ellis St
- 1610 Oregon St
- 1535 Julia St
- 1538 Ashby Ave
- 2727 McGee Ave
- 2701 Grant St
- 2045 Emerson St
- 2057 Emerson St
- 1530 Stuart St
- 1741 Derby St
- 3110 California St
- 3114 California St
- 1507 Prince St
- 3138 California St
- 2110 Ashby Ave
- 1612 Carleton St
- 3233 Ellis St
- 2790 Sacramento St
- 2782 Sacramento St
- 2774 Sacramento St
- 2930 Harper St
- 2934 Harper St
- 2936 Harper St
- 2928 Harper St
- 2928 Harper St
- 2929 Ellis St
- 2924 Harper St
- 2938 Harper St
- 2923 Ellis St
- 2918 Harper St
- 2921 Ellis St
- 2929 Harper St
- 2927 Harper St
- 2937 Harper St
- 2917 Ellis St
- 2912 Harper St
- 2941 Harper St
- 2914 Harper St Unit B
- 2923 Harper St
- 1825 Ashby Ave
Your Personal Tour Guide
Ask me questions while you tour the home.