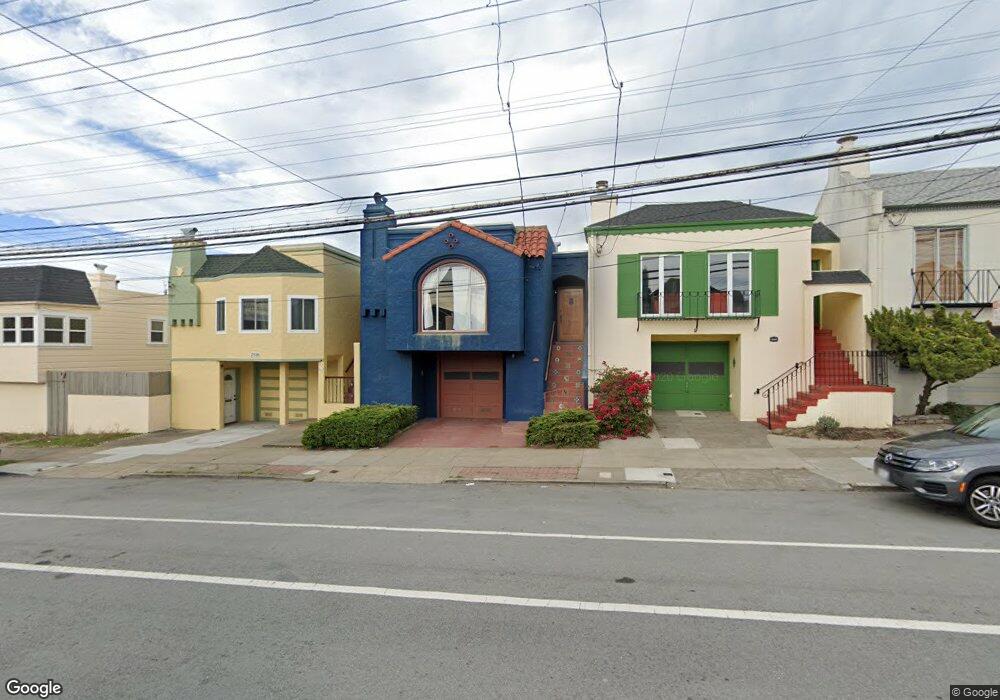
2932 Kirkham St San Francisco, CA 94122
Central Sunset NeighborhoodEstimated Value: $1,316,000 - $2,642,706
3
Beds
2
Baths
1,545
Sq Ft
$1,360/Sq Ft
Est. Value
About This Home
This home is located at 2932 Kirkham St, San Francisco, CA 94122 and is currently estimated at $2,100,677, approximately $1,359 per square foot. 2932 Kirkham St is a home located in San Francisco County with nearby schools including Stevenson (Robert Louis) Elementary School, Giannini (A.P.) Middle School, and Holy Name Elementary School.
Ownership History
Date
Name
Owned For
Owner Type
Purchase Details
Closed on
Jan 26, 2009
Sold by
Humphrey Michael T and Humphrey Stephanie T
Bought by
Humphrey Michael T and Humphrey Stephanie T
Current Estimated Value
Purchase Details
Closed on
Nov 11, 2004
Sold by
Humphrey Michael T and Humphrey Stephanie T
Bought by
Humphrey Michael T and Humphrey Stephanie T
Purchase Details
Closed on
Oct 30, 2003
Sold by
Bauman Richard J
Bought by
Humphrey Michael T and Humphrey Stephanie T
Home Financials for this Owner
Home Financials are based on the most recent Mortgage that was taken out on this home.
Original Mortgage
$270,000
Outstanding Balance
$124,999
Interest Rate
5.98%
Mortgage Type
Purchase Money Mortgage
Estimated Equity
$1,975,678
Create a Home Valuation Report for This Property
The Home Valuation Report is an in-depth analysis detailing your home's value as well as a comparison with similar homes in the area
Home Values in the Area
Average Home Value in this Area
Purchase History
| Date | Buyer | Sale Price | Title Company |
|---|---|---|---|
| Humphrey Michael T | -- | None Available | |
| Humphrey Michael T | -- | -- | |
| Humphrey Michael T | $630,000 | Old Republic Title Company |
Source: Public Records
Mortgage History
| Date | Status | Borrower | Loan Amount |
|---|---|---|---|
| Open | Humphrey Michael T | $270,000 |
Source: Public Records
Tax History Compared to Growth
Tax History
| Year | Tax Paid | Tax Assessment Tax Assessment Total Assessment is a certain percentage of the fair market value that is determined by local assessors to be the total taxable value of land and additions on the property. | Land | Improvement |
|---|---|---|---|---|
| 2025 | $32,128 | $2,735,890 | $537,412 | $2,198,478 |
| 2024 | $32,128 | $2,682,250 | $526,876 | $2,155,374 |
| 2023 | $25,014 | $2,065,934 | $516,546 | $1,549,388 |
| 2022 | $17,894 | $1,461,702 | $506,418 | $955,284 |
| 2021 | $15,640 | $1,269,320 | $496,490 | $772,830 |
| 2020 | $15,462 | $1,235,410 | $491,400 | $744,010 |
| 2019 | $13,543 | $1,093,542 | $481,766 | $611,776 |
| 2018 | $10,235 | $827,004 | $472,320 | $354,684 |
| 2017 | $9,815 | $810,790 | $463,060 | $347,730 |
| 2016 | $9,643 | $794,896 | $453,982 | $340,914 |
| 2015 | $9,522 | $782,958 | $447,164 | $335,794 |
| 2014 | $9,270 | $767,624 | $438,406 | $329,218 |
Source: Public Records
Map
Nearby Homes