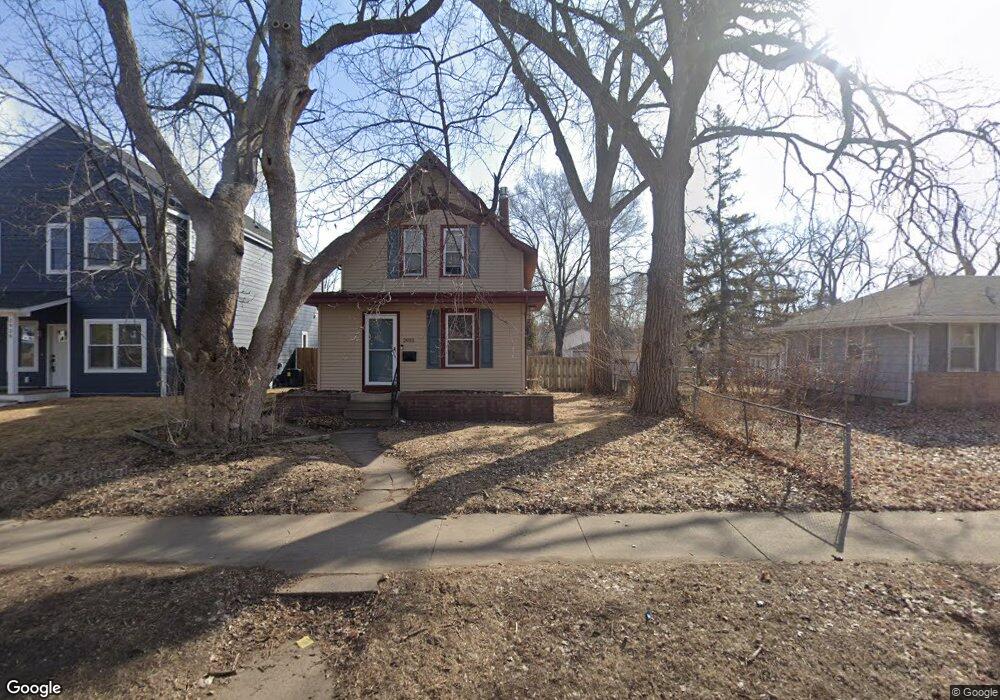
2933 2933 Salem Ave S St. Louis Park, MN 55416
Fern Hill NeighborhoodEstimated Value: $363,000 - $407,000
2
Beds
2
Baths
1,085
Sq Ft
$349/Sq Ft
Est. Value
About This Home
This home is located at 2933 2933 Salem Ave S, St. Louis Park, MN 55416 and is currently estimated at $378,600, approximately $348 per square foot. 2933 2933 Salem Ave S is a home located in Hennepin County with nearby schools including Susan Lindgren Elementary School, St. Louis Park Middle School, and St. Louis Park High School.
Ownership History
Date
Name
Owned For
Owner Type
Purchase Details
Closed on
Aug 18, 2021
Sold by
Johnson Kyle R and Gilbert Danielle
Bought by
Hunninghake Jack
Current Estimated Value
Home Financials for this Owner
Home Financials are based on the most recent Mortgage that was taken out on this home.
Original Mortgage
$305,550
Outstanding Balance
$277,613
Interest Rate
2.7%
Mortgage Type
Stand Alone Second
Estimated Equity
$100,987
Purchase Details
Closed on
Aug 1, 2014
Sold by
Stoer Ryan L
Bought by
Johnson Kyle R
Home Financials for this Owner
Home Financials are based on the most recent Mortgage that was taken out on this home.
Original Mortgage
$268,055
Interest Rate
3.75%
Mortgage Type
FHA
Purchase Details
Closed on
Sep 1, 2009
Sold by
Watson Chad
Bought by
Stoer Ryan L
Purchase Details
Closed on
May 31, 2005
Sold by
Wyrowski Theodore S
Bought by
Watson Chad
Purchase Details
Closed on
Jun 23, 2004
Sold by
Milek Christine
Bought by
Wyrowski Ted
Purchase Details
Closed on
May 2, 1992
Sold by
Schulstrom Steve
Bought by
Milek Perry O
Create a Home Valuation Report for This Property
The Home Valuation Report is an in-depth analysis detailing your home's value as well as a comparison with similar homes in the area
Home Values in the Area
Average Home Value in this Area
Purchase History
| Date | Buyer | Sale Price | Title Company |
|---|---|---|---|
| Hunninghake Jack | $315,000 | Land Title Inc | |
| Johnson Kyle R | $273,000 | Midland Title | |
| Stoer Ryan L | $234,900 | -- | |
| Watson Chad | $210,000 | -- | |
| Wyrowski Ted | -- | -- | |
| Milek Perry O | $77,000 | -- | |
| Hunninghake Jack Jack | $315,000 | -- |
Source: Public Records
Mortgage History
| Date | Status | Borrower | Loan Amount |
|---|---|---|---|
| Open | Hunninghake Jack | $305,550 | |
| Closed | Hunninghake Jack | $305,550 | |
| Previous Owner | Johnson Kyle R | $268,055 | |
| Closed | Milek Perry O | -- | |
| Closed | Hunninghake Jack Jack | $305,550 |
Source: Public Records
Tax History Compared to Growth
Tax History
| Year | Tax Paid | Tax Assessment Tax Assessment Total Assessment is a certain percentage of the fair market value that is determined by local assessors to be the total taxable value of land and additions on the property. | Land | Improvement |
|---|---|---|---|---|
| 2024 | $4,467 | $333,200 | $176,700 | $156,500 |
| 2023 | $4,300 | $329,400 | $175,900 | $153,500 |
| 2022 | $3,684 | $321,100 | $167,600 | $153,500 |
| 2021 | $3,442 | $285,400 | $145,800 | $139,600 |
| 2020 | $3,420 | $270,900 | $138,900 | $132,000 |
| 2019 | $3,391 | $259,600 | $137,600 | $122,000 |
| 2018 | $3,322 | $249,600 | $131,100 | $118,500 |
| 2017 | $3,014 | $224,300 | $103,700 | $120,600 |
| 2016 | $3,024 | $217,700 | $98,000 | $119,700 |
| 2015 | $2,885 | $203,500 | $91,600 | $111,900 |
| 2014 | -- | $198,300 | $86,900 | $111,400 |
Source: Public Records
Map
Nearby Homes
- 2930 Salem Ave
- 2744 Toledo Ave S
- 2910 Vernon Ave S
- 4625 Minnetonka Blvd Unit 105
- 2936 Monterey Ave S
- 3201 Xenwood Ave S
- 2955 Yosemite Ave S
- 3005 Monterey Ave
- 2960 Zarthan Ave S
- 3106 Zarthan Ave S
- 2724 Yosemite Ave S
- 2656 Xenwood Ave S
- 2833 Alabama Ave S
- 2921 Blackstone Ave
- 2648 Yosemite Ave S
- 2633 Zarthan Ave S
- 2644 Zarthan Ave S Unit 20
- 2841 Brunswick Ave S
- 2653 Joppa Ave S
- 4100 Sunset Blvd
- 2933 Salem Ave
- 2934 2934 Salem Ave
- 2925 Salem Ave
- 2937 Salem Ave
- 2919 Salem Ave
- 2915 Salem Ave
- 2934 Salem Ave
- 2915 Salem Ave
- 2922 Salem Ave
- 2940 Salem Ave
- 2930 Raleigh Ave
- 2924 Raleigh Ave
- 2936 Raleigh Ave
- 2920 Raleigh Ave
- 2916 Salem Ave
- 2920 Raleigh Ave
- 2916 Raleigh Ave
- 2907 Salem Ave
- 2908 Salem Ave
- 2908 Raleigh Ave