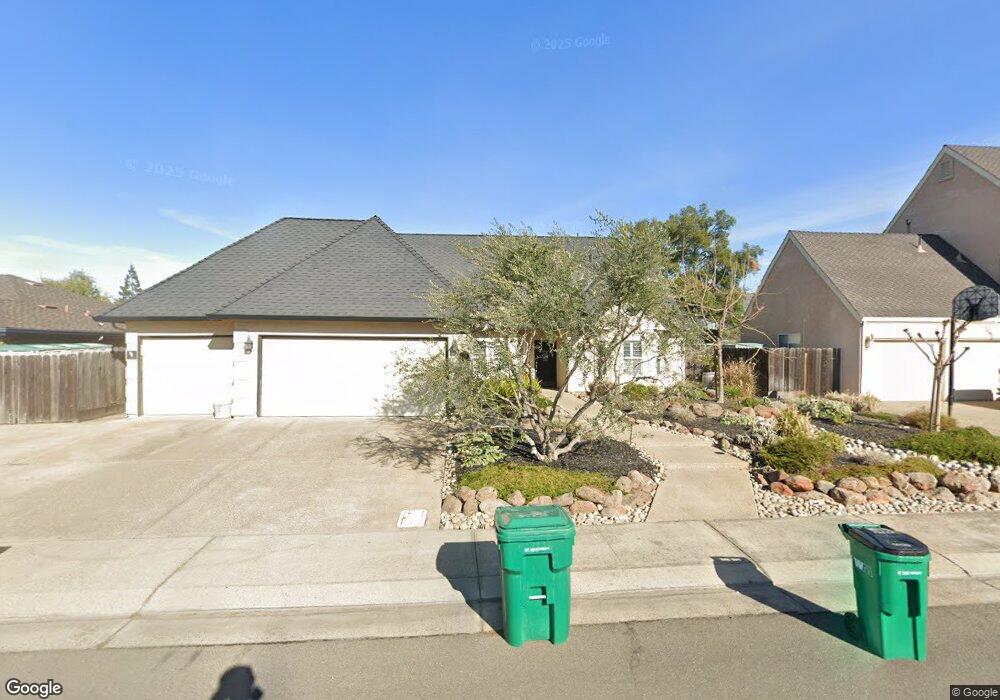
2933 Park Oak Dr Lodi, CA 95242
Sunwest NeighborhoodEstimated Value: $691,584 - $721,000
4
Beds
3
Baths
2,676
Sq Ft
$265/Sq Ft
Est. Value
About This Home
This home is located at 2933 Park Oak Dr, Lodi, CA 95242 and is currently estimated at $708,646, approximately $264 per square foot. 2933 Park Oak Dr is a home located in San Joaquin County with nearby schools including Erma B. Reese Elementary School, Millswood Middle School, and Lodi High School.
Ownership History
Date
Name
Owned For
Owner Type
Purchase Details
Closed on
Apr 1, 1999
Sold by
Hines Patrick H and Hines Julie C
Bought by
Grim Jonathan E and Grim Stephanie A
Current Estimated Value
Home Financials for this Owner
Home Financials are based on the most recent Mortgage that was taken out on this home.
Original Mortgage
$157,600
Interest Rate
6.91%
Purchase Details
Closed on
Apr 19, 1996
Sold by
Rachlin James B and Rachlin Vicki L
Bought by
Hines Patrick H and Hines Julie C
Home Financials for this Owner
Home Financials are based on the most recent Mortgage that was taken out on this home.
Original Mortgage
$176,700
Interest Rate
7.58%
Purchase Details
Closed on
Jul 3, 1993
Sold by
Karczewski Chester and Karczewski Maureen A
Bought by
Rachlin James B
Home Financials for this Owner
Home Financials are based on the most recent Mortgage that was taken out on this home.
Original Mortgage
$110,000
Interest Rate
7.79%
Create a Home Valuation Report for This Property
The Home Valuation Report is an in-depth analysis detailing your home's value as well as a comparison with similar homes in the area
Home Values in the Area
Average Home Value in this Area
Purchase History
| Date | Buyer | Sale Price | Title Company |
|---|---|---|---|
| Grim Jonathan E | $197,000 | Old Republic Title Company | |
| Hines Patrick H | $186,000 | Commonwealth Land Title | |
| Rachlin James B | $202,000 | Central Valley Title Co |
Source: Public Records
Mortgage History
| Date | Status | Borrower | Loan Amount |
|---|---|---|---|
| Closed | Grim Jonathan E | $157,600 | |
| Previous Owner | Hines Patrick H | $176,700 | |
| Previous Owner | Rachlin James B | $110,000 |
Source: Public Records
Tax History Compared to Growth
Tax History
| Year | Tax Paid | Tax Assessment Tax Assessment Total Assessment is a certain percentage of the fair market value that is determined by local assessors to be the total taxable value of land and additions on the property. | Land | Improvement |
|---|---|---|---|---|
| 2025 | $3,278 | $308,819 | $86,216 | $222,603 |
| 2024 | $3,187 | $302,765 | $84,526 | $218,239 |
| 2023 | $3,149 | $296,829 | $82,869 | $213,960 |
| 2022 | $3,078 | $291,010 | $81,245 | $209,765 |
| 2021 | $3,132 | $285,304 | $79,652 | $205,652 |
| 2020 | $3,050 | $282,380 | $78,836 | $203,544 |
| 2019 | $2,987 | $276,844 | $77,291 | $199,553 |
| 2018 | $2,944 | $271,417 | $75,776 | $195,641 |
| 2017 | $2,877 | $266,096 | $74,291 | $191,805 |
| 2016 | $2,695 | $260,879 | $72,834 | $188,045 |
| 2014 | $2,628 | $251,927 | $70,335 | $181,592 |
Source: Public Records
Map
Nearby Homes
- 324 Applewood Dr
- 2633 Bayberry Dr
- 2816 Applewood Dr
- 2526 Park West Dr
- 2651 Douglas Fir Dr
- 3021 Belmont Dr
- 2670 Manza Ct
- 991 Harvest Crossing St
- 1111 Brighton Way
- 2408 Tejon St
- 450 W Turner Rd
- 2585 Buttercup Dr
- 3033 Concerto St
- 208 Palomar Dr
- 2495 Macarthur Pkwy
- 2438 Central Park Dr
- 2400 Eilers Ln Unit 1703
- 2400 Eilers Ln Unit 1607
- 931 W Sargent Rd
- 2355 Woodlake Cir
- 2925 Park Oak Dr
- 3001 Park Oak Dr
- 2936 Fernwood Dr Unit 49
- 3000 Fernwood Dr
- 2928 Fernwood Dr
- 2917 Park Oak Dr
- 3009 Park Oak Dr
- 2932 Park Oak Dr
- 3008 Fernwood Dr
- 2924 Park Oak Dr
- 3000 Park Oak Dr
- 2920 Fernwood Dr
- 2916 Park Oak Dr
- 2909 Park Oak Dr
- 3017 Park Oak Dr
- 3008 Park Oak Dr
- 3016 Fernwood Dr
- 2943 Fernwood Dr
- 2912 Fernwood Dr
- 2935 Fernwood Dr