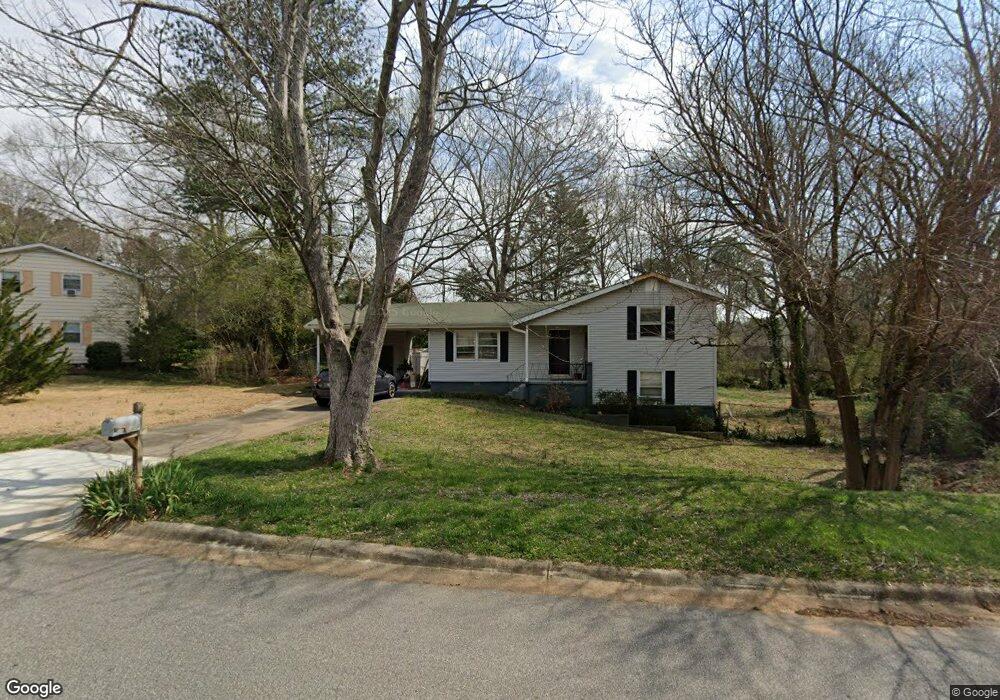
2933 Strathmoor Rd SE Smyrna, GA 30080
Estimated Value: $346,000 - $434,000
2
Beds
2
Baths
1,028
Sq Ft
$369/Sq Ft
Est. Value
About This Home
This home is located at 2933 Strathmoor Rd SE, Smyrna, GA 30080 and is currently estimated at $379,472, approximately $369 per square foot. 2933 Strathmoor Rd SE is a home located in Cobb County with nearby schools including Smyrna Elementary School, Campbell Middle School, and Campbell High School.
Ownership History
Date
Name
Owned For
Owner Type
Purchase Details
Closed on
Jan 26, 2014
Sold by
Lewyn Esther
Bought by
Lewyn Lawrence
Current Estimated Value
Purchase Details
Closed on
Jan 18, 2014
Sold by
Lewyn Lawrence David
Bought by
Lewyn Esther
Purchase Details
Closed on
Apr 18, 2008
Sold by
Taylor Tommie
Bought by
Lewyn Lawrence and Lewyn Esther S
Purchase Details
Closed on
Feb 27, 2004
Sold by
Maier Andreas
Bought by
Taylor Tommie
Home Financials for this Owner
Home Financials are based on the most recent Mortgage that was taken out on this home.
Original Mortgage
$169,000
Interest Rate
5.68%
Mortgage Type
New Conventional
Purchase Details
Closed on
Mar 24, 1999
Sold by
Halleck Stephen V and Halleck Gail D
Bought by
Maier Andreas
Home Financials for this Owner
Home Financials are based on the most recent Mortgage that was taken out on this home.
Original Mortgage
$77,000
Interest Rate
6.82%
Mortgage Type
New Conventional
Create a Home Valuation Report for This Property
The Home Valuation Report is an in-depth analysis detailing your home's value as well as a comparison with similar homes in the area
Home Values in the Area
Average Home Value in this Area
Purchase History
| Date | Buyer | Sale Price | Title Company |
|---|---|---|---|
| Lewyn Lawrence | -- | -- | |
| Lewyn Esther | -- | -- | |
| Lewyn Lawrence | $181,300 | -- | |
| Taylor Tommie | $169,000 | -- | |
| Maier Andreas | $110,000 | -- |
Source: Public Records
Mortgage History
| Date | Status | Borrower | Loan Amount |
|---|---|---|---|
| Previous Owner | Taylor Tommie | $169,000 | |
| Previous Owner | Maier Andreas | $77,000 |
Source: Public Records
Tax History Compared to Growth
Tax History
| Year | Tax Paid | Tax Assessment Tax Assessment Total Assessment is a certain percentage of the fair market value that is determined by local assessors to be the total taxable value of land and additions on the property. | Land | Improvement |
|---|---|---|---|---|
| 2025 | $3,382 | $124,520 | $28,000 | $96,520 |
| 2024 | $3,382 | $124,520 | $28,000 | $96,520 |
| 2023 | $3,382 | $124,520 | $28,000 | $96,520 |
| 2022 | $3,407 | $124,520 | $28,000 | $96,520 |
| 2021 | $2,790 | $101,504 | $28,000 | $73,504 |
| 2020 | $2,320 | $84,396 | $22,000 | $62,396 |
| 2019 | $2,265 | $82,404 | $20,000 | $62,404 |
| 2018 | $2,265 | $82,404 | $20,000 | $62,404 |
| 2017 | $1,581 | $61,292 | $20,000 | $41,292 |
| 2016 | $1,581 | $61,292 | $20,000 | $41,292 |
| 2015 | $1,226 | $46,424 | $20,000 | $26,424 |
| 2014 | $1,237 | $46,424 | $0 | $0 |
Source: Public Records
Map
Nearby Homes
- 1876 Balmoral Rd SE
- 1903 Lochlomand Ln SE
- 2010 Glenroy Dr SE
- 1944 Terri Meyer Dr SE
- 1837 Lochlomand Ln SE
- 1913 Heathridge Ct SE
- 1836 Lochlomand Ln SE
- 1801 Lochlomand Ln SE
- 801 Countryside Place SE
- 2324 Goodwood Blvd SE
- 1799 Timber Valley Way SE
- 2376 Oakwood Way SE
- 2327 Goodwood Blvd SE
- 2791 Madison St SE
- 2051 Dundee Dr SE
- 1601 Countryside Place SE
- 1502 Countryside Place SE
- 110 Countryside Place SE
- 108 Countryside Place SE
- 2999 Jonquil Dr SE
- 1935 Inverness Rd SE
- 0 Strathmoor Rd Unit 8860598
- 0 Strathmoor Rd Unit 8547867
- 0 Strathmoor Rd Unit 8635930
- 0 Strathmoor Rd
- 1941 Inverness Rd SE
- 2951 Strathmoor Rd SE Unit 2
- 1955 Inverness Rd SE
- 2938 Strathmoor Rd SE Unit 2
- 2928 Strathmoor Rd SE
- 1835 Balmoral Rd SE
- 2916 Strathmoor Rd SE
- 2948 Strathmoor Rd SE
- 1965 Inverness Rd SE Unit 2
- 2899 Strathmoor Rd SE
- 2900 Strathmoor Rd SE
- 2960 Strathmoor Rd SE
- 1845 Balmoral Rd SE Unit 2
- 1930 Inverness Rd SE Unit 22
- 1930 Inverness Rd SE