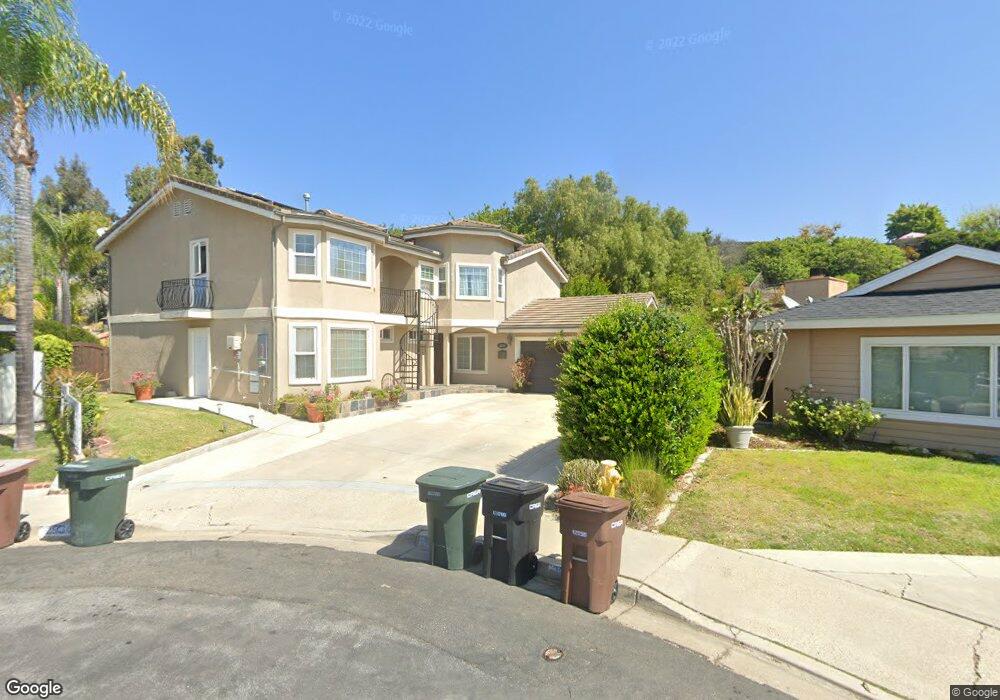
29341 Via Portola Laguna Niguel, CA 92677
Estimated Value: $1,724,000 - $2,171,125
5
Beds
5
Baths
3,000
Sq Ft
$633/Sq Ft
Est. Value
About This Home
This home is located at 29341 Via Portola, Laguna Niguel, CA 92677 and is currently estimated at $1,899,531, approximately $633 per square foot. 29341 Via Portola is a home located in Orange County with nearby schools including Hidden Hills Elementary, Niguel Hills Middle School, and Dana Hills High School.
Ownership History
Date
Name
Owned For
Owner Type
Purchase Details
Closed on
Mar 18, 2020
Sold by
Shokrian Seyed and Amini Mitra
Bought by
Shokrian Seyed and Amini Mitra
Current Estimated Value
Purchase Details
Closed on
Feb 12, 1999
Sold by
The Hyster Y Quiamco Living Trust
Bought by
Shokrian Seyed S and Amini Mitra
Home Financials for this Owner
Home Financials are based on the most recent Mortgage that was taken out on this home.
Original Mortgage
$216,000
Interest Rate
7.04%
Mortgage Type
Balloon
Purchase Details
Closed on
Nov 10, 1998
Sold by
Quiamco Hyster Y
Bought by
Quiamco Hyster Y and The Hyster Y Quiamco Living Trust
Purchase Details
Closed on
Apr 3, 1996
Sold by
Emerson David E and Emerson Nan Louise
Bought by
Quiamco Hyster Y and Lui Tom
Home Financials for this Owner
Home Financials are based on the most recent Mortgage that was taken out on this home.
Original Mortgage
$192,600
Interest Rate
7.8%
Create a Home Valuation Report for This Property
The Home Valuation Report is an in-depth analysis detailing your home's value as well as a comparison with similar homes in the area
Home Values in the Area
Average Home Value in this Area
Purchase History
| Date | Buyer | Sale Price | Title Company |
|---|---|---|---|
| Shokrian Seyed | -- | None Available | |
| Shokrian Seyd | -- | None Available | |
| Shokrian Seyed S | $270,000 | First Southwestern Title Co | |
| Quiamco Hyster Y | -- | -- | |
| Quiamco Hyster Y | $214,000 | Guardian Title Company |
Source: Public Records
Mortgage History
| Date | Status | Borrower | Loan Amount |
|---|---|---|---|
| Previous Owner | Shokrian Seyed S | $216,000 | |
| Previous Owner | Quiamco Hyster Y | $192,600 | |
| Closed | Shokrian Seyed S | $54,000 |
Source: Public Records
Tax History Compared to Growth
Tax History
| Year | Tax Paid | Tax Assessment Tax Assessment Total Assessment is a certain percentage of the fair market value that is determined by local assessors to be the total taxable value of land and additions on the property. | Land | Improvement |
|---|---|---|---|---|
| 2025 | $6,391 | $649,509 | $330,775 | $318,734 |
| 2024 | $6,391 | $636,774 | $324,289 | $312,485 |
| 2023 | $6,254 | $624,289 | $317,931 | $306,358 |
| 2022 | $6,134 | $612,049 | $311,698 | $300,351 |
| 2021 | $6,014 | $600,049 | $305,587 | $294,462 |
| 2020 | $5,954 | $593,897 | $302,454 | $291,443 |
| 2019 | $5,835 | $582,252 | $296,523 | $285,729 |
| 2018 | $5,722 | $570,836 | $290,709 | $280,127 |
| 2017 | $5,609 | $559,644 | $285,009 | $274,635 |
| 2016 | $5,500 | $548,671 | $279,421 | $269,250 |
| 2015 | $5,416 | $540,430 | $275,224 | $265,206 |
| 2014 | $5,311 | $529,844 | $269,833 | $260,011 |
Source: Public Records
Map
Nearby Homes
- 25112 Armagosa Dr
- 25111 Adelanto Dr
- 29181 Via San Sebastian
- 24877 Nueva Vista Dr Unit 23
- 24839 Nueva Vista Dr Unit 5
- 29592 Los Osos Dr
- 24705 Queens Ct
- 29282 Rue Cerise Unit 7
- 24615 Kings Rd
- 24862 Vista Rancho
- 25085 Sanoria St
- 29901 Weatherwood
- 28721 Placida Ave
- 24822 Cutter
- 28621 Rancho Del Sol
- 28793 El Adolfo
- 24625 Los Serranos Dr
- 30042 Oceanus
- 28645 Via Pasatiempo
- 82 Largo St
- 29351 Via Portola
- 29342 Via Portola
- 25072 Monte Verde Dr
- 25082 Monte Verde Dr
- 25062 Monte Verde Dr
- 25092 Monte Verde Dr
- 29352 Las Cruces
- 29361 Via Portola
- 29352 Via Portola
- 25042 Monte Verde Dr
- 29361 San Briso Place
- 25102 Monte Verde Dr
- 29362 Via Portola
- 29371 San Briso Place
- 29362 Las Cruces
- 29371 Via Portola
- 25032 Monte Verde Dr
- 25112 Monte Verde Dr
- 29381 San Briso Place
- 29341 Las Cruces