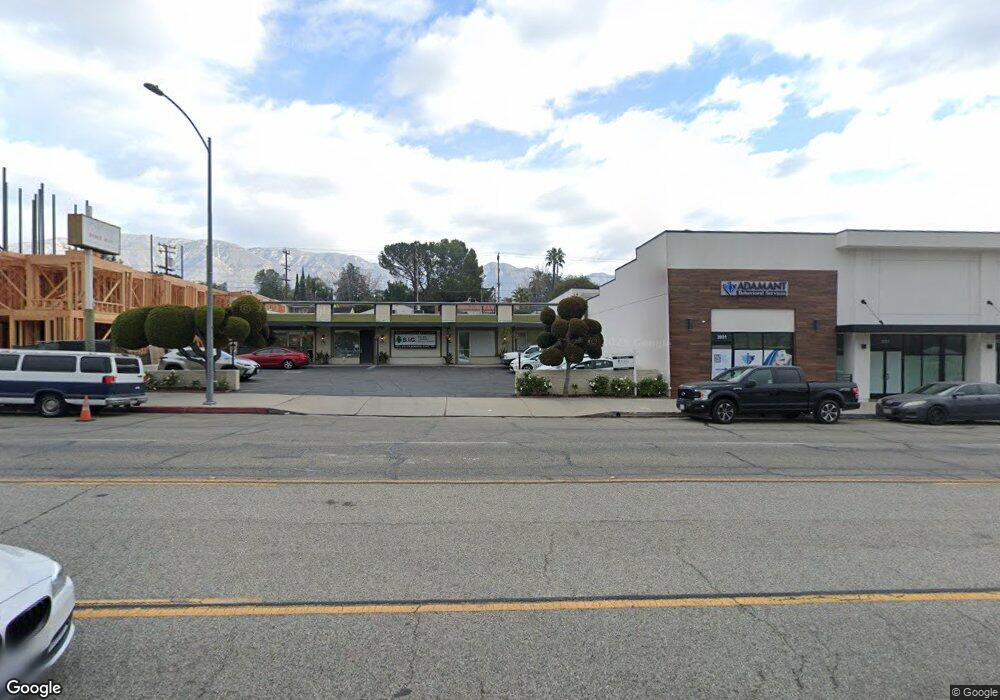
2935 Honolulu Ave Glendale, CA 91214
Estimated Value: $1,966,035
Studio
--
Bath
4,000
Sq Ft
$492/Sq Ft
Est. Value
About This Home
This home is located at 2935 Honolulu Ave, Glendale, CA 91214 and is currently estimated at $1,966,035, approximately $491 per square foot. 2935 Honolulu Ave is a home located in Los Angeles County with nearby schools including La Crescenta Elementary School, Rosemont Middle School, and Crescenta Valley High School.
Ownership History
Date
Name
Owned For
Owner Type
Purchase Details
Closed on
May 14, 2015
Sold by
Shaar Michael
Bought by
Haar Michael R and The Michael R Shaar Separate P
Current Estimated Value
Purchase Details
Closed on
Aug 10, 2010
Sold by
Khoury Maribel
Bought by
Shaar Michael
Purchase Details
Closed on
Aug 2, 2010
Sold by
Veres Cynthia A
Bought by
Bozigian Jeffrey J
Purchase Details
Closed on
Jul 28, 2010
Sold by
Bozigian Jeffrey J
Bought by
Shaar Michael
Purchase Details
Closed on
Sep 9, 2009
Sold by
Veres Joseph and Veres Cynthia A
Bought by
Veres Cynthia A
Home Financials for this Owner
Home Financials are based on the most recent Mortgage that was taken out on this home.
Original Mortgage
$200,000
Interest Rate
5.2%
Mortgage Type
Commercial
Purchase Details
Closed on
Mar 31, 2008
Sold by
Bozigian Jerry J
Bought by
The Jerry J Bozigian Revocable Living Tr
Create a Home Valuation Report for This Property
The Home Valuation Report is an in-depth analysis detailing your home's value as well as a comparison with similar homes in the area
Home Values in the Area
Average Home Value in this Area
Purchase History
| Date | Buyer | Sale Price | Title Company |
|---|---|---|---|
| Haar Michael R | -- | None Available | |
| Shaar Michael | -- | First American Title Co La | |
| Bozigian Jeffrey J | -- | First American Title Co La | |
| Shaar Michael | $815,000 | Fatcola | |
| Veres Cynthia A | -- | Accommodation | |
| Veres Cynthia A | -- | Accommodation | |
| The Jerry J Bozigian Revocable Living Tr | -- | None Available |
Source: Public Records
Mortgage History
| Date | Status | Borrower | Loan Amount |
|---|---|---|---|
| Previous Owner | Veres Cynthia A | $200,000 |
Source: Public Records
Tax History
| Year | Tax Paid | Tax Assessment Tax Assessment Total Assessment is a certain percentage of the fair market value that is determined by local assessors to be the total taxable value of land and additions on the property. | Land | Improvement |
|---|---|---|---|---|
| 2025 | $12,101 | $1,044,148 | $787,918 | $256,230 |
| 2024 | $12,101 | $1,023,675 | $772,469 | $251,206 |
| 2023 | $11,842 | $1,003,604 | $757,323 | $246,281 |
| 2022 | $11,322 | $983,926 | $742,474 | $241,452 |
| 2021 | $11,119 | $964,634 | $727,916 | $236,718 |
| 2019 | $10,705 | $936,025 | $706,327 | $229,698 |
| 2018 | $10,344 | $917,673 | $692,478 | $225,195 |
| 2016 | $9,852 | $882,040 | $665,589 | $216,451 |
| 2015 | $9,653 | $868,792 | $655,592 | $213,200 |
| 2014 | $9,574 | $851,774 | $642,750 | $209,024 |
Source: Public Records
Map
Nearby Homes
- 2806 Manhattan Ave
- 3055 Sycamore Ave
- 2817 Montrose Ave
- 2743 Montrose Ave Unit 110
- 2905 Montrose Ave Unit 610
- 3010 Montrose Ave Unit 33
- 2944 Mayfield Ave
- 2727 Altura Ave
- 2629 Altura Ave
- 1255 Oak Circle Dr
- 2700 Prospect Ave
- 2608 Honolulu Ave Unit 310
- 3130 Montrose Ave Unit 102
- 2434 Prospect Ave
- 3629 Sierra Vista Ave
- 2442 Cross St
- 0 Mountain Oaks Park
- 3417 Oakmont View Dr
- 4123 Ocean View Blvd
- 4731 Briggs Ave
- 2941 Honolulu Ave
- 2943 Honolulu Ave
- 3821 Glenwood Ave
- 2906 Hermosa Ave
- 2936 Honolulu Ave Unit D
- 2936 Honolulu Ave
- 2910 Hermosa Ave
- 2902 Hermosa Ave
- 2950 Honolulu Ave
- 2950 Honolulu Ave Unit G
- 2914 Hermosa Ave
- 2957 Honolulu Ave
- 2918 Hermosa Ave
- 3820 Glenwood Ave
- 2951 Honolulu Ave Unit G
- 2848 Hermosa Ave
- 2952 Honolulu Ave
- 2846 Hermosa Ave
- 2907 Hermosa Ave
- 2924 Hermosa Ave
Your Personal Tour Guide
Ask me questions while you tour the home.