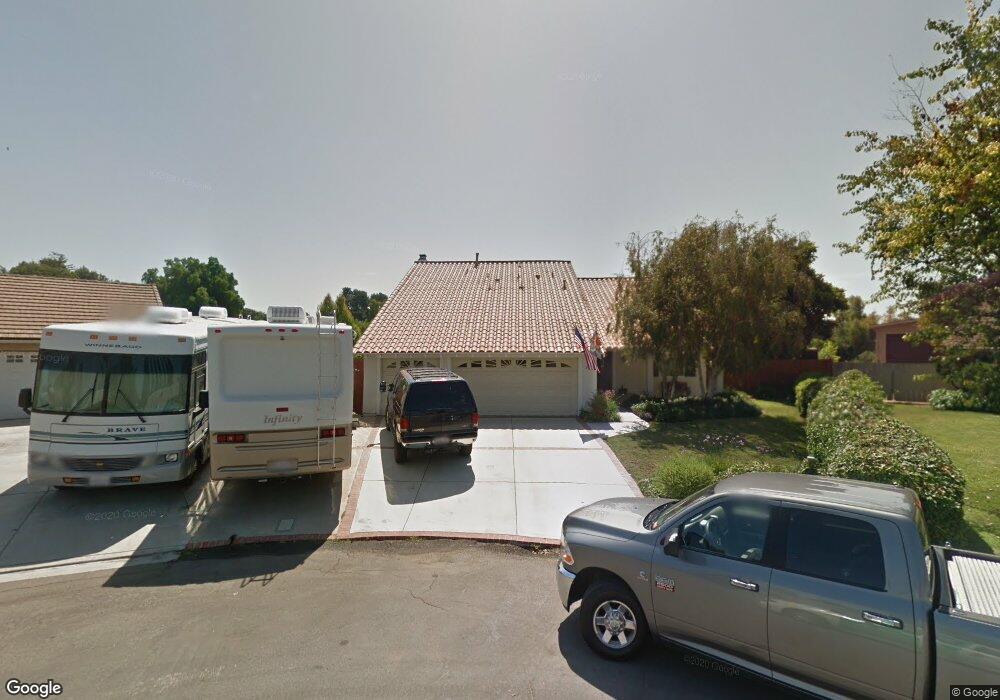
2935 Via Del Caballo Blanco Bonita, CA 91902
Bonita North NeighborhoodEstimated Value: $1,297,000 - $1,464,000
5
Beds
3
Baths
3,076
Sq Ft
$452/Sq Ft
Est. Value
About This Home
This home is located at 2935 Via Del Caballo Blanco, Bonita, CA 91902 and is currently estimated at $1,390,441, approximately $452 per square foot. 2935 Via Del Caballo Blanco is a home located in San Diego County with nearby schools including Valley Vista Elementary School, Bonita Vista Middle School, and Bonita Vista Senior High School.
Ownership History
Date
Name
Owned For
Owner Type
Purchase Details
Closed on
Aug 19, 2010
Sold by
Insko Allan B and Insko Susan K
Bought by
Insko Allan B and Insko Susan K
Current Estimated Value
Home Financials for this Owner
Home Financials are based on the most recent Mortgage that was taken out on this home.
Original Mortgage
$350,000
Interest Rate
4.38%
Mortgage Type
New Conventional
Purchase Details
Closed on
Jul 2, 2007
Sold by
Insko Allan B and Insko Susan K
Bought by
Insko Allan B and Insko Susan K
Home Financials for this Owner
Home Financials are based on the most recent Mortgage that was taken out on this home.
Original Mortgage
$313,000
Interest Rate
6.41%
Mortgage Type
New Conventional
Purchase Details
Closed on
Mar 26, 2004
Sold by
Insko Allan Bruce and Insko Susan Kay
Bought by
Insko Allan B and Insko Susan K
Create a Home Valuation Report for This Property
The Home Valuation Report is an in-depth analysis detailing your home's value as well as a comparison with similar homes in the area
Home Values in the Area
Average Home Value in this Area
Purchase History
| Date | Buyer | Sale Price | Title Company |
|---|---|---|---|
| Insko Allan B | -- | Accommodation | |
| Insko Allan B | -- | Fidelity National Title Co | |
| Insko Allan B | -- | Accommodation | |
| Insko Allan B | -- | Southland Title Company | |
| Insko Allan B | -- | -- | |
| Insko Allan Bruce | -- | -- |
Source: Public Records
Mortgage History
| Date | Status | Borrower | Loan Amount |
|---|---|---|---|
| Closed | Insko Allan B | $350,000 | |
| Closed | Insko Allan B | $313,000 |
Source: Public Records
Tax History Compared to Growth
Tax History
| Year | Tax Paid | Tax Assessment Tax Assessment Total Assessment is a certain percentage of the fair market value that is determined by local assessors to be the total taxable value of land and additions on the property. | Land | Improvement |
|---|---|---|---|---|
| 2025 | $5,716 | $446,791 | $67,858 | $378,933 |
| 2024 | $5,716 | $438,031 | $66,528 | $371,503 |
| 2023 | $5,613 | $429,443 | $65,224 | $364,219 |
| 2022 | $5,436 | $421,024 | $63,946 | $357,078 |
| 2021 | $5,326 | $412,770 | $62,693 | $350,077 |
| 2020 | $5,170 | $408,539 | $62,051 | $346,488 |
| 2019 | $5,037 | $400,530 | $60,835 | $339,695 |
| 2018 | $4,915 | $392,678 | $59,643 | $333,035 |
| 2017 | $4,775 | $384,979 | $58,474 | $326,505 |
| 2016 | $4,640 | $377,431 | $57,328 | $320,103 |
| 2015 | $4,571 | $371,762 | $56,467 | $315,295 |
| 2014 | $4,498 | $364,480 | $55,361 | $309,119 |
Source: Public Records
Map
Nearby Homes
- 2904 Saddlewood Dr
- 3020 Plaza Lorenzo
- 5274 Margaret St
- 2920 Briarwood Rd
- 2920 Briarwood Rd Unit G11
- 2920 Briarwood Rd Unit C15
- 2920 Briarwood Rd Unit K13
- 3069 Plaza Natalia
- 1882 Olamar Way
- 5790 Casa Grande Way
- 5595 Sweetwater Rd
- 7479 Tooma St Unit B
- 1939 Manzana Way
- 2333 Spring Oak Way
- 8304 the Grant Place
- 2876 Casey St Unit B
- 2329 Grove View Rd
- 7089 Wattle Dr
- 5361 Central Ave
- 275 S Worthington St Unit SPC 112
- 2944 Via Del Caballo Blanco
- 2927 Via Del Caballo Blanco
- 5110 Nannette St
- 2936 Via Del Caballo Blanco
- 5137 Nannette St
- 3006 Bonita Woods Dr
- 3041 Picasso Dr
- 2928 Via Del Caballo Blanco
- 3025 Picasso Dr
- 5102 Senda Angosta
- 3009 Picasso Dr
- 3016 Bonita Woods Dr
- 2820 Via Del Caballo Blanco
- 5205 Nannette St
- 5126 Nannette St
- 3019 Bonita Woods Dr
- 5213 Renoir Ln
- 3028 Bonita Woods Dr
- 5225 Renoir Ln
- 5108 Senda Angosta