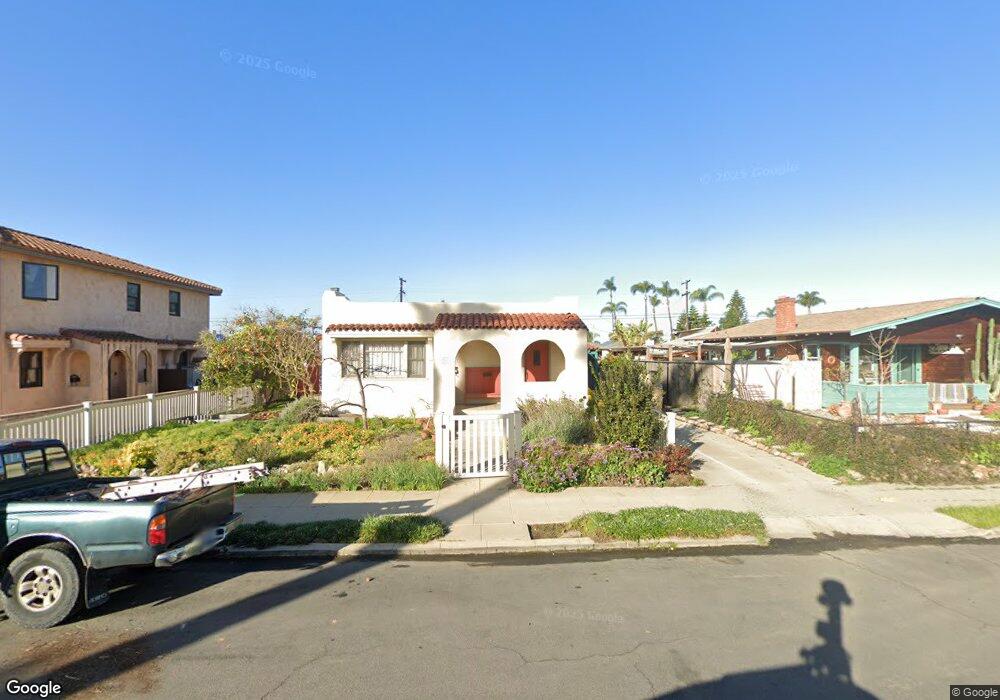
2936 29th St San Diego, CA 92104
North Park NeighborhoodEstimated Value: $1,287,543 - $1,471,000
3
Beds
2
Baths
1,384
Sq Ft
$988/Sq Ft
Est. Value
About This Home
This home is located at 2936 29th St, San Diego, CA 92104 and is currently estimated at $1,367,636, approximately $988 per square foot. 2936 29th St is a home located in San Diego County with nearby schools including McKinley Elementary School, Roosevelt International Middle School, and Mcgill School Of Success.
Ownership History
Date
Name
Owned For
Owner Type
Purchase Details
Closed on
Jun 4, 2005
Sold by
Bonus Loretta C
Bought by
Bonus Loretta C
Current Estimated Value
Purchase Details
Closed on
May 24, 2004
Sold by
Bonus Kenneth E and Bonus Loretta C
Bought by
Bonus Loretta C
Home Financials for this Owner
Home Financials are based on the most recent Mortgage that was taken out on this home.
Original Mortgage
$195,000
Outstanding Balance
$94,120
Interest Rate
5.92%
Mortgage Type
New Conventional
Estimated Equity
$1,273,516
Purchase Details
Closed on
Jan 12, 1999
Sold by
Bonus Kenneth E and Bonus Loretta C
Bought by
Bonus Kenneth E and Bonus Loretta C
Home Financials for this Owner
Home Financials are based on the most recent Mortgage that was taken out on this home.
Original Mortgage
$130,800
Interest Rate
6.63%
Purchase Details
Closed on
Jun 26, 1996
Sold by
Bonus Kenneth E and Bonus Loretta C
Bought by
Bonus Kenneth E and Bonus Loretta C
Purchase Details
Closed on
Jul 15, 1983
Create a Home Valuation Report for This Property
The Home Valuation Report is an in-depth analysis detailing your home's value as well as a comparison with similar homes in the area
Home Values in the Area
Average Home Value in this Area
Purchase History
| Date | Buyer | Sale Price | Title Company |
|---|---|---|---|
| Bonus Loretta C | -- | -- | |
| Bonus Loretta C | -- | Fidelity National Title Co | |
| Bonus Kenneth E | -- | Stewart Title | |
| Bonus Kenneth E | -- | -- | |
| -- | $95,800 | -- |
Source: Public Records
Mortgage History
| Date | Status | Borrower | Loan Amount |
|---|---|---|---|
| Open | Bonus Loretta C | $195,000 | |
| Closed | Bonus Kenneth E | $130,800 |
Source: Public Records
Tax History Compared to Growth
Tax History
| Year | Tax Paid | Tax Assessment Tax Assessment Total Assessment is a certain percentage of the fair market value that is determined by local assessors to be the total taxable value of land and additions on the property. | Land | Improvement |
|---|---|---|---|---|
| 2025 | $2,369 | $198,332 | $90,100 | $108,232 |
| 2024 | $2,369 | $194,444 | $88,334 | $106,110 |
| 2023 | $2,314 | $190,632 | $86,602 | $104,030 |
| 2022 | $2,249 | $186,895 | $84,904 | $101,991 |
| 2021 | $2,231 | $183,232 | $83,240 | $99,992 |
| 2020 | $2,203 | $181,354 | $82,387 | $98,967 |
| 2019 | $2,163 | $177,799 | $80,772 | $97,027 |
| 2018 | $2,023 | $174,314 | $79,189 | $95,125 |
| 2017 | $80 | $170,897 | $77,637 | $93,260 |
| 2016 | $1,939 | $167,547 | $76,115 | $91,432 |
| 2015 | $1,909 | $165,031 | $74,972 | $90,059 |
| 2014 | $1,878 | $161,799 | $73,504 | $88,295 |
Source: Public Records
Map
Nearby Homes
- 2950 Nutmeg St
- 3005 Olive St
- 2931 Thorn St
- 3132 31st St
- 4070 4078 Texas St
- 0 35th St
- 3376 30th St
- 3365-69 Grim Ave
- 3365 Grim Ave
- 2433 San Marcos Ave
- 3124-26 32nd St
- 2920 Bancroft St
- 3045-49 Juniper St
- 2919 Ivy St
- 3520 Herman Ave Unit 1
- 2144 30th St
- 2126-34 30th St
- 3533 Louisiana St
- 3537 Louisiana St
- 2335 33rd St