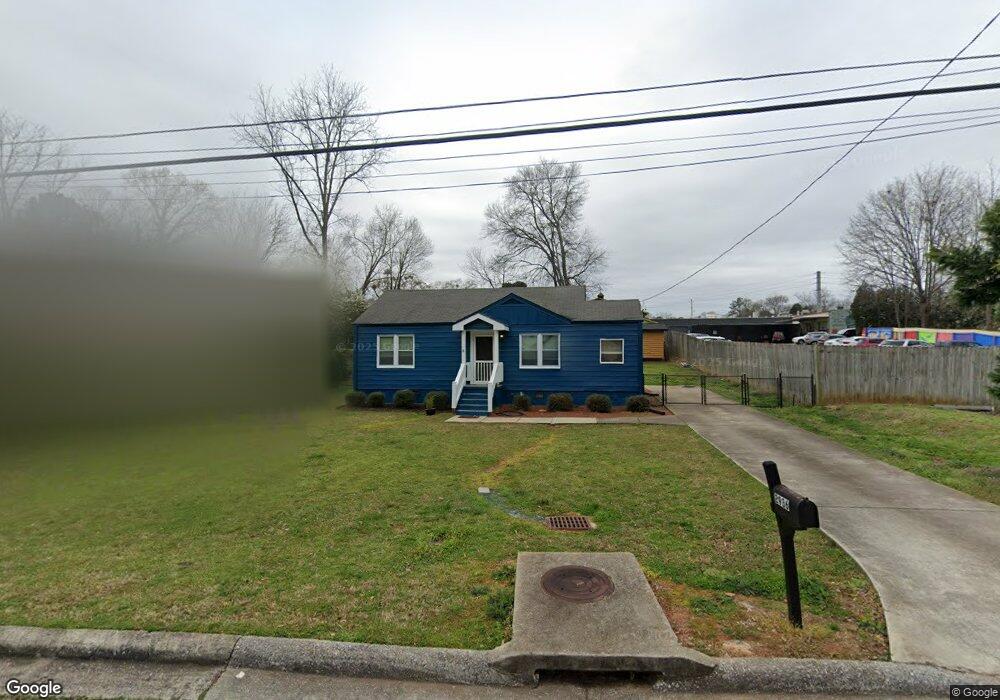
2936 Emory Rd SE Smyrna, GA 30080
Estimated Value: $288,000 - $397,000
3
Beds
1
Bath
953
Sq Ft
$341/Sq Ft
Est. Value
About This Home
This home is located at 2936 Emory Rd SE, Smyrna, GA 30080 and is currently estimated at $325,431, approximately $341 per square foot. 2936 Emory Rd SE is a home located in Cobb County with nearby schools including Smyrna Elementary School, Campbell Middle School, and Campbell High School.
Ownership History
Date
Name
Owned For
Owner Type
Purchase Details
Closed on
Apr 26, 2012
Sold by
Shope Fred M
Bought by
Shope Fred M Jr Living Trust
Current Estimated Value
Purchase Details
Closed on
Jul 6, 2006
Sold by
Griffin Barry D
Bought by
Shope Fred M
Purchase Details
Closed on
Jul 15, 2002
Sold by
Elle Jusin
Bought by
Griffin Barry D
Home Financials for this Owner
Home Financials are based on the most recent Mortgage that was taken out on this home.
Original Mortgage
$78,750
Interest Rate
6.67%
Mortgage Type
New Conventional
Purchase Details
Closed on
Jul 1, 1997
Sold by
Stallworth Holliman
Bought by
Homeside Lending Inc
Purchase Details
Closed on
Apr 26, 1994
Sold by
E E H J Inc
Bought by
Stallworth Beverly H
Home Financials for this Owner
Home Financials are based on the most recent Mortgage that was taken out on this home.
Original Mortgage
$54,250
Interest Rate
7.81%
Mortgage Type
FHA
Create a Home Valuation Report for This Property
The Home Valuation Report is an in-depth analysis detailing your home's value as well as a comparison with similar homes in the area
Home Values in the Area
Average Home Value in this Area
Purchase History
| Date | Buyer | Sale Price | Title Company |
|---|---|---|---|
| Shope Fred M Jr Living Trust | -- | -- | |
| Shope Fred M | $140,000 | -- | |
| Griffin Barry D | $87,500 | -- | |
| Homeside Lending Inc | $60,077 | -- | |
| Stallworth Beverly H | $54,900 | -- |
Source: Public Records
Mortgage History
| Date | Status | Borrower | Loan Amount |
|---|---|---|---|
| Previous Owner | Griffin Barry D | $78,750 | |
| Previous Owner | Stallworth Beverly H | $54,250 |
Source: Public Records
Tax History Compared to Growth
Tax History
| Year | Tax Paid | Tax Assessment Tax Assessment Total Assessment is a certain percentage of the fair market value that is determined by local assessors to be the total taxable value of land and additions on the property. | Land | Improvement |
|---|---|---|---|---|
| 2025 | $2,398 | $88,280 | $42,000 | $46,280 |
| 2024 | $2,641 | $97,248 | $30,000 | $67,248 |
| 2023 | $2,641 | $97,248 | $30,000 | $67,248 |
| 2022 | $2,661 | $97,248 | $30,000 | $67,248 |
| 2021 | $2,272 | $82,636 | $30,000 | $52,636 |
| 2020 | $2,243 | $81,608 | $28,000 | $53,608 |
| 2019 | $1,365 | $49,652 | $20,000 | $29,652 |
| 2018 | $1,365 | $49,652 | $20,000 | $29,652 |
| 2017 | $1,266 | $49,076 | $18,000 | $31,076 |
| 2016 | $1,266 | $49,076 | $18,000 | $31,076 |
| 2015 | $917 | $34,748 | $18,000 | $16,748 |
| 2014 | $636 | $23,848 | $0 | $0 |
Source: Public Records
Map
Nearby Homes
- 2999 Jonquil Dr SE
- 1552 Mosaic Way
- 1560 Mosaic Way
- 2791 Madison St SE
- 1801 Lochlomand Ln SE
- 1837 Lochlomand Ln SE
- 1582 Mosaic Way Unit 1582
- 2964 Anderson Cir SE
- 1836 Lochlomand Ln SE
- 1652 Mosaic Way
- 3064 Montclair Cir SE
- 2861 Bernard Ln SE
- 1303 Vinings Forest Ln SE
- 1903 Lochlomand Ln SE
- 1579 Walker St SE
- 1203 Vinings Forest Ln SE Unit 12
- 1799 Timber Valley Way SE
- 1700 Wynndowne Trail SE Unit C
- 1913 Heathridge Ct SE
- 3028 Montclair Cir SE
- 2946 Emory Rd SE
- 0 Emory Ln SE Unit 7466033
- 0 Emory Ln SE Unit 7076488
- 0 Emory Ln SE Unit 8703810
- 0 Emory Ln SE Unit 7570368
- 0 Emory Ln SE Unit 7309942
- 0 Emory Ln SE Unit 7497697
- 2940 Lexington Trace Dr SE
- 2944 Lexington Trace Dr SE
- 2956 Emory Rd SE
- 2942 Lexington Trace Dr SE Unit 2
- 2916 Emory Rd SE
- 2946 Lexington Trace Dr SE
- 2948 Lexington Trace Dr SE
- 2966 Emory Rd SE
- 2906 Emory Rd SE
- 2928 Lexington Trace Dr SE
- 2965 Emory Rd SE
- 2950 Lexington Trace Dr SE Unit 2
- 2952 Lexington Trace Dr SE