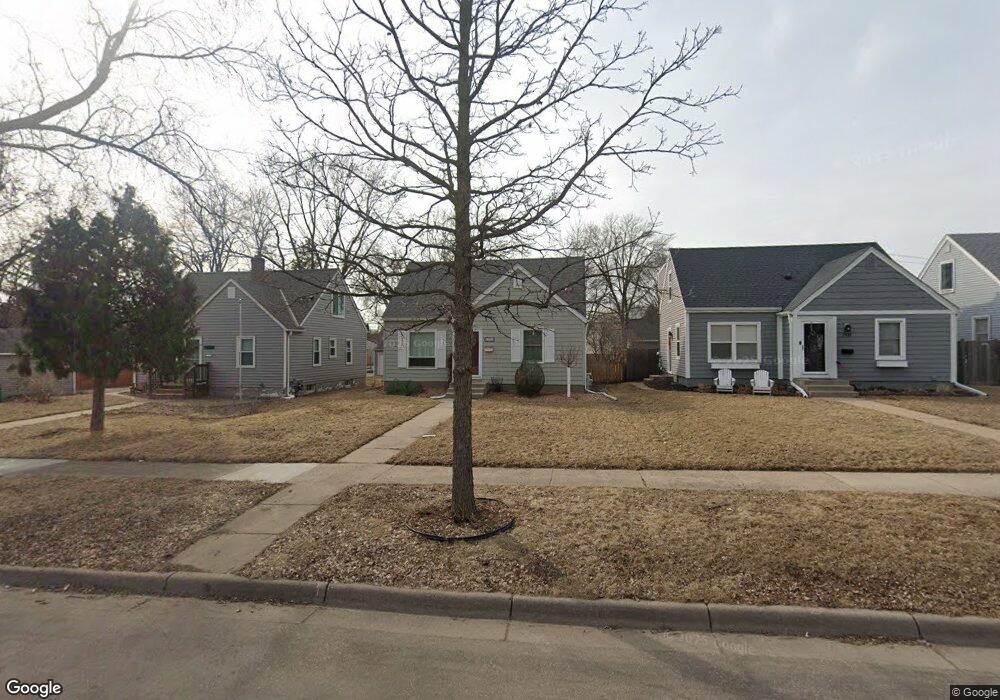
2936 Hampshire Ave S Saint Louis Park, MN 55426
Bronx Park NeighborhoodEstimated Value: $401,901 - $437,000
3
Beds
2
Baths
1,197
Sq Ft
$353/Sq Ft
Est. Value
About This Home
This home is located at 2936 Hampshire Ave S, Saint Louis Park, MN 55426 and is currently estimated at $421,975, approximately $352 per square foot. 2936 Hampshire Ave S is a home located in Hennepin County with nearby schools including Peter Hobart Elementary School, St. Louis Park Middle School, and St. Louis Park High School.
Ownership History
Date
Name
Owned For
Owner Type
Purchase Details
Closed on
Jul 18, 2016
Sold by
Keefe William F O
Bought by
Rousar Kelly J
Current Estimated Value
Home Financials for this Owner
Home Financials are based on the most recent Mortgage that was taken out on this home.
Original Mortgage
$221,600
Outstanding Balance
$177,018
Interest Rate
3.6%
Mortgage Type
New Conventional
Estimated Equity
$244,957
Purchase Details
Closed on
Apr 25, 2011
Sold by
Murray Steven J and Murray Katya
Bought by
Holmberg Nina L and Okeefe William F
Home Financials for this Owner
Home Financials are based on the most recent Mortgage that was taken out on this home.
Original Mortgage
$185,000
Interest Rate
4.77%
Mortgage Type
New Conventional
Purchase Details
Closed on
Jul 16, 2004
Sold by
Boen Nicholas C
Bought by
Murray Steven J
Purchase Details
Closed on
Sep 30, 1998
Sold by
Boen Susan B
Bought by
Boen Nicholas C
Purchase Details
Closed on
Mar 7, 1996
Sold by
Simenson William
Bought by
Boen Susan B
Create a Home Valuation Report for This Property
The Home Valuation Report is an in-depth analysis detailing your home's value as well as a comparison with similar homes in the area
Home Values in the Area
Average Home Value in this Area
Purchase History
| Date | Buyer | Sale Price | Title Company |
|---|---|---|---|
| Rousar Kelly J | $277,000 | Titlesmart Inc | |
| Holmberg Nina L | $234,000 | Burnet Title | |
| Holmberg Nina L | $234,000 | -- | |
| Murray Steven J | $220,000 | -- | |
| Boen Nicholas C | $103,000 | -- | |
| Boen Susan B | $79,200 | -- |
Source: Public Records
Mortgage History
| Date | Status | Borrower | Loan Amount |
|---|---|---|---|
| Open | Rousar Kelly J | $221,600 | |
| Previous Owner | Holmberg Nina L | $185,000 |
Source: Public Records
Tax History Compared to Growth
Tax History
| Year | Tax Paid | Tax Assessment Tax Assessment Total Assessment is a certain percentage of the fair market value that is determined by local assessors to be the total taxable value of land and additions on the property. | Land | Improvement |
|---|---|---|---|---|
| 2024 | $5,257 | $385,300 | $134,900 | $250,400 |
| 2023 | $4,798 | $364,000 | $132,300 | $231,700 |
| 2022 | $4,261 | $363,400 | $131,700 | $231,700 |
| 2021 | $4,116 | $325,300 | $114,600 | $210,700 |
| 2020 | $4,010 | $317,900 | $109,200 | $208,700 |
| 2019 | $3,807 | $299,100 | $104,000 | $195,100 |
| 2018 | $3,783 | $276,500 | $99,100 | $177,400 |
| 2017 | $3,415 | $250,100 | $78,400 | $171,700 |
| 2016 | $3,458 | $244,700 | $70,800 | $173,900 |
| 2015 | $3,228 | $224,300 | $66,200 | $158,100 |
| 2014 | -- | $205,900 | $62,800 | $143,100 |
Source: Public Records
Map
Nearby Homes
- 2852 Hampshire Ave S
- 2925 Georgia Ave S
- 2849 Jersey Ave S
- 2910 Edgewood Ave S
- 3056 Florida Ave S
- 3131 Georgia Ave S
- 2732 Idaho Ave S
- 7217 Minnetonka Blvd
- 2700 Georgia Ave S
- 2744 Dakota Ave S
- 3200 Edgewood Ave S
- 2724 Dakota Ave S
- 2707 Edgewood Ave S
- 3101 Nevada Ave S
- 3124 Maryland Ave S
- 3216 Kentucky Ave S
- 2622 Idaho Ave S
- 2841 Brunswick Ave S
- 3149 Nevada Ave S
- 2813 Brunswick Ave S
- 2932 Hampshire Ave S
- 2940 Hampshire Ave S
- 2928 Hampshire Ave S
- 2936 2936 Hampshire Ave S
- 2932 2932 Hampshire-Avenue-s
- 2932 2932 Hampshire Ave S
- 2924 Hampshire Ave S
- 2924R Hampshire Ave S
- 2937 Idaho Ave S
- 6808 Minnetonka Blvd
- 2941 Idaho Ave S
- 6800 Minnetonka Blvd
- 2931 Idaho Ave S
- 6812 Minnetonka Blvd
- 6808 Minnetonka Blvd
- 2920 Hampshire Ave S
- 6812 Minnetonka Blvd
- 6818 Minnetonka Blvd
- 2925 Idaho Ave S
- 6818 Minnetonka Blvd