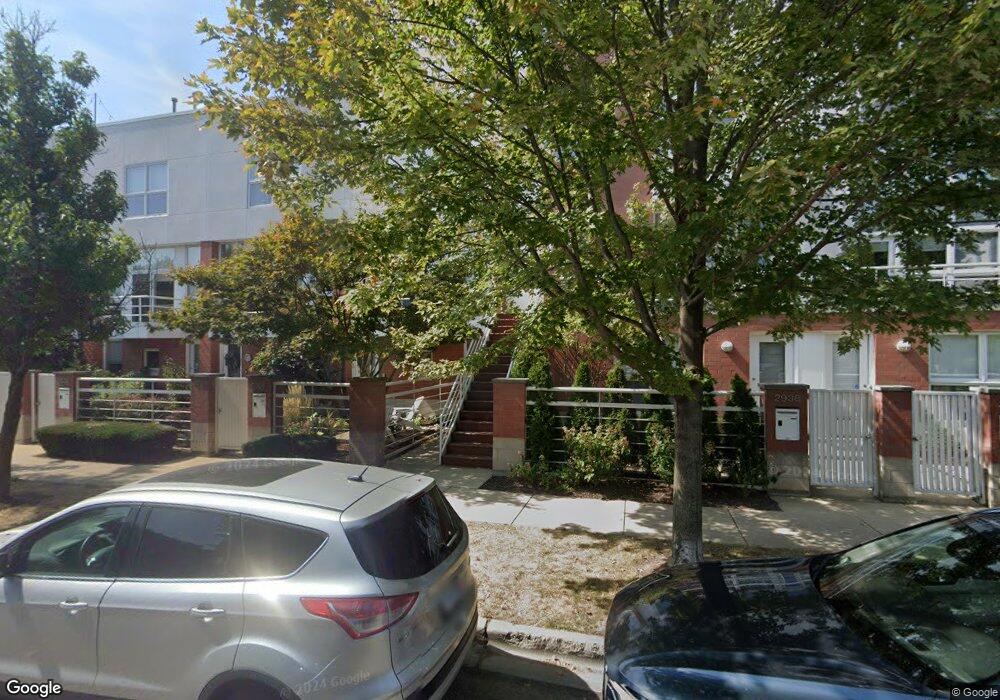
2936 N Hermitage Ave Chicago, IL 60657
Southport Corridor NeighborhoodEstimated Value: $889,000 - $980,000
3
Beds
4
Baths
2,561
Sq Ft
$359/Sq Ft
Est. Value
About This Home
This home is located at 2936 N Hermitage Ave, Chicago, IL 60657 and is currently estimated at $919,256, approximately $358 per square foot. 2936 N Hermitage Ave is a home located in Cook County with nearby schools including Augustus H. Burley Elementary School, Lake View High School, and Alphonsus Academy & Center For The Arts.
Ownership History
Date
Name
Owned For
Owner Type
Purchase Details
Closed on
Feb 20, 2012
Sold by
Stilwell Marcia L and Haliezka Robert T
Bought by
Haliczka Robert T and Haliczka Marcia L
Current Estimated Value
Purchase Details
Closed on
Jun 19, 2009
Sold by
Gentili Eugene J and Gentili Sandra L
Bought by
Haliczka Robert T and Stilwell Marcia L
Home Financials for this Owner
Home Financials are based on the most recent Mortgage that was taken out on this home.
Original Mortgage
$173,000
Outstanding Balance
$112,506
Interest Rate
5.32%
Mortgage Type
Unknown
Estimated Equity
$806,750
Purchase Details
Closed on
Aug 5, 2005
Sold by
Rusteberg Todd A and Rusteberg Sonal M
Bought by
Gentili Eugene J and Gentili Sandra L
Home Financials for this Owner
Home Financials are based on the most recent Mortgage that was taken out on this home.
Original Mortgage
$320,000
Interest Rate
5.62%
Mortgage Type
Unknown
Purchase Details
Closed on
Jan 17, 2002
Sold by
Wellington Park Development Llc
Bought by
Rusteberg Todd A and Rusteberg Sonal M
Create a Home Valuation Report for This Property
The Home Valuation Report is an in-depth analysis detailing your home's value as well as a comparison with similar homes in the area
Home Values in the Area
Average Home Value in this Area
Purchase History
| Date | Buyer | Sale Price | Title Company |
|---|---|---|---|
| Haliczka Robert T | -- | Prairie Title | |
| Haliczka Robert T | $572,000 | First American Title Ins Co | |
| Gentili Eugene J | $620,000 | Git | |
| Rusteberg Todd A | $550,000 | -- |
Source: Public Records
Mortgage History
| Date | Status | Borrower | Loan Amount |
|---|---|---|---|
| Open | Haliczka Robert T | $173,000 | |
| Previous Owner | Gentili Eugene J | $320,000 |
Source: Public Records
Tax History Compared to Growth
Tax History
| Year | Tax Paid | Tax Assessment Tax Assessment Total Assessment is a certain percentage of the fair market value that is determined by local assessors to be the total taxable value of land and additions on the property. | Land | Improvement |
|---|---|---|---|---|
| 2024 | $12,171 | $74,432 | $27,230 | $47,202 |
| 2023 | $11,843 | $61,000 | $21,960 | $39,040 |
| 2022 | $11,843 | $61,000 | $21,960 | $39,040 |
| 2021 | $11,597 | $61,000 | $21,960 | $39,040 |
| 2020 | $12,437 | $58,930 | $21,960 | $36,970 |
| 2019 | $12,180 | $64,055 | $21,960 | $42,095 |
| 2018 | $11,974 | $64,055 | $21,960 | $42,095 |
| 2017 | $11,960 | $58,935 | $19,324 | $39,611 |
| 2016 | $11,304 | $58,935 | $19,324 | $39,611 |
| 2015 | $10,319 | $58,935 | $19,324 | $39,611 |
| 2014 | $7,575 | $43,396 | $17,860 | $25,536 |
| 2013 | $7,414 | $43,396 | $17,860 | $25,536 |
Source: Public Records
Map
Nearby Homes
- 1808 W Diversey Pkwy Unit E
- 1720 W Surf St Unit 36
- 2953 N Honore St
- 1759 W Wellington Ave
- 2903 N Wolcott Ave Unit A
- 1800 W Diversey Pkwy Unit D
- 1712 W Surf St Unit 40
- 1710 W Surf St Unit 41
- 2809 N Wolcott Ave Unit 2809C
- 1910 W George St
- 1735 W Diversey Pkwy Unit 208
- 1735 W Diversey Pkwy Unit 402
- 1928 W Wolfram St
- 1924 W Diversey Pkwy Unit 3E
- 1932 W Wolfram St
- 1737 W Barry Ave Unit A
- 1749 W Barry Ave
- 2754 N Paulina St Unit 2754
- 2941 N Damen Ave Unit 2
- 3009 N Damen Ave Unit 2
- 2946 N Hermitage Ave
- 2944 N Hermitage Ave
- 2948 N Hermitage Ave
- 2942 N Hermitage Ave
- 2950 N Hermitage Ave
- 2940 N Hermitage Ave
- 2940 N Hermitage Ave
- 2940 N Hermitage Ave
- 2938 N Hermitage Ave
- 2938 N Hermitage Ave Unit E7
- 2934 N Hermitage Ave
- 1739 W Wellington Ave
- 1741 W Wellington Ave
- 1737 W Wellington Ave
- 1745 W Wellington Ave
- 2946 N Wood St Unit F
- 2946 N Wood St Unit B
- 2946 N Wood St Unit B
- 2946 N Wood St
- 2946 N Wood St