NOT LISTED FOR SALE

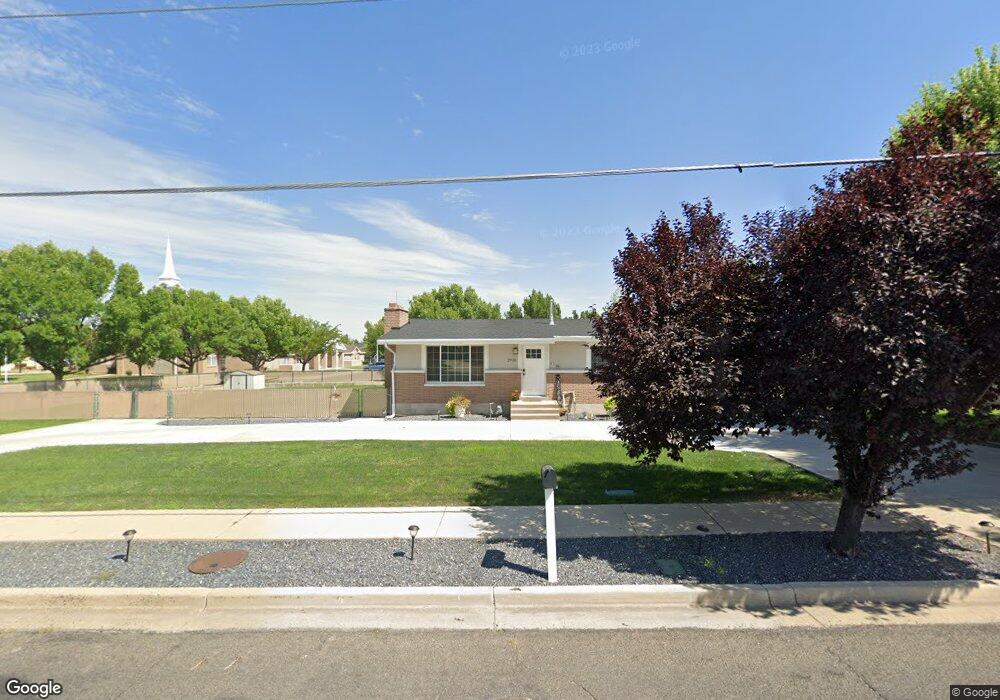
2936 W 1800 N Clearfield, UT 84015

Estimated Value: $414,000 - $472,015

4 Beds
3 Baths
2,304 Sq Ft
$193/Sq Ft Est. Value

About This Home

This home is located at 2936 W 1800 N, Clearfield, UT 84015 and is currently estimated at $444,504, approximately $192 per square foot. 2936 W 1800 N is a home located in Davis County with nearby schools including West Clinton Elementary School, West Point Junior High School, and Clearfield High School.

Ownership History

Date Name Owned For Owner Type

Purchase Details

Closed on
Dec 8, 2020
Sold by
Marquardt Skyler T
Bought by
Harris Colten and Welsh Eryn
Current Estimated Value
$444,504

Home Financials for this Owner

Home Financials are based on the most recent Mortgage that was taken out on this home.
Original Mortgage
$326,968
Outstanding Balance
$296,867
Interest Rate
2.8%
Mortgage Type
FHA
Estimated Equity
$133,480

Purchase Details

Closed on
Jun 6, 2014
Sold by
Dalton Matthew
Bought by
Caldwell Investments Llc

Home Financials for this Owner

Home Financials are based on the most recent Mortgage that was taken out on this home.
Original Mortgage
$82,500
Interest Rate
4.27%
Mortgage Type
Purchase Money Mortgage

Purchase Details

Closed on
Jul 31, 2007
Sold by
Dalton Charles H
Bought by
Dalton Matthew

Home Financials for this Owner

Home Financials are based on the most recent Mortgage that was taken out on this home.
Original Mortgage
$62,400
Interest Rate
6.66%
Mortgage Type
Purchase Money Mortgage

Range of Values:

Collateral Analytics

Collateral Analytics Collateral Analytics AVMs (Automated Valuation Model) employ a number of statistical approaches combined with neighborhood-specific comparable selection guarantees the most up-to-date and precise valuations.

Not Available

Collateral Analytics does not have data for the current month. Please view the chart for historical values.

ICE

ICE Mortgage Technology ICE Mortgage Technology’s AVM (Automated Valuation Model) is a state-of-the-art online residential property valuation tool that provides a quick and accurate estimate of the value of almost any home in the U.S.

Not Available

ICE Mortgage Technology does not have data for the current month. Please view the chart for historical values.

First American

First American First American Data & Analytics’ next-generation AVM combines unrivaled data assets with a blended ensemble of valuation models to produce highly accurate, reliable valuations you can trust.

Not Available

First American does not have data for the current month. Please view the chart for historical values.

Quantarium

Quantarium Quantarium’s valuation service, repeatedly proven the industry’s most accurate and comprehensive, is supercharged with a self-learning and auto-tuning AI engine that continually becomes smarter and more accurate as it processes daily inputs from the industry’s leading RE data lake.

Not Available

Quantarium does not have data for the current month. Please view the chart for historical values.

Average Value
Not Available
List Price
Sold Price
Create a Home Valuation Report for This Property
The Home Valuation Report is an in-depth analysis detailing your home's value as well as a comparison with similar homes in the area

Home Values in the Area

Source: Public Records

Average Home Value in this Area


Source: Public Records

Purchase History

Date Buyer Sale Price Title Company
Harris Colten -- First American Title
Caldwell Investments Llc -- None Available
Dalton Matthew -- Patriot National Title Ins
Source: Public Records

Mortgage History

Date Status Borrower Loan Amount
Open Harris Colten $326,968
Previous Owner Caldwell Investments Llc $82,500
Previous Owner Dalton Matthew $80,000
Previous Owner Dalton Matthew $62,400
Source: Public Records

Tax History Compared to Growth

Source: Public Records

Tax History

Year Tax Paid Tax Assessment Tax Assessment Total Assessment is a certain percentage of the fair market value that is determined by local assessors to be the total taxable value of land and additions on the property. Land Improvement
2024 $2,196 $212,300 $127,478 $84,822
2023 $2,074 $371,000 $150,918 $220,082
2022 $2,179 $215,600 $85,266 $130,334
2021 $2,173 $319,000 $118,836 $200,164
2020 $1,742 $253,000 $107,963 $145,037
2019 $1,642 $233,000 $113,460 $119,540
2018 $1,521 $212,000 $94,276 $117,724
2016 $1,289 $92,785 $38,074 $54,711
2015 $1,461 $63,470 $38,074 $25,396
2014 $864 $60,074 $38,074 $22,000
2013 -- $72,027 $27,958 $44,069
Source: Public Records

Map