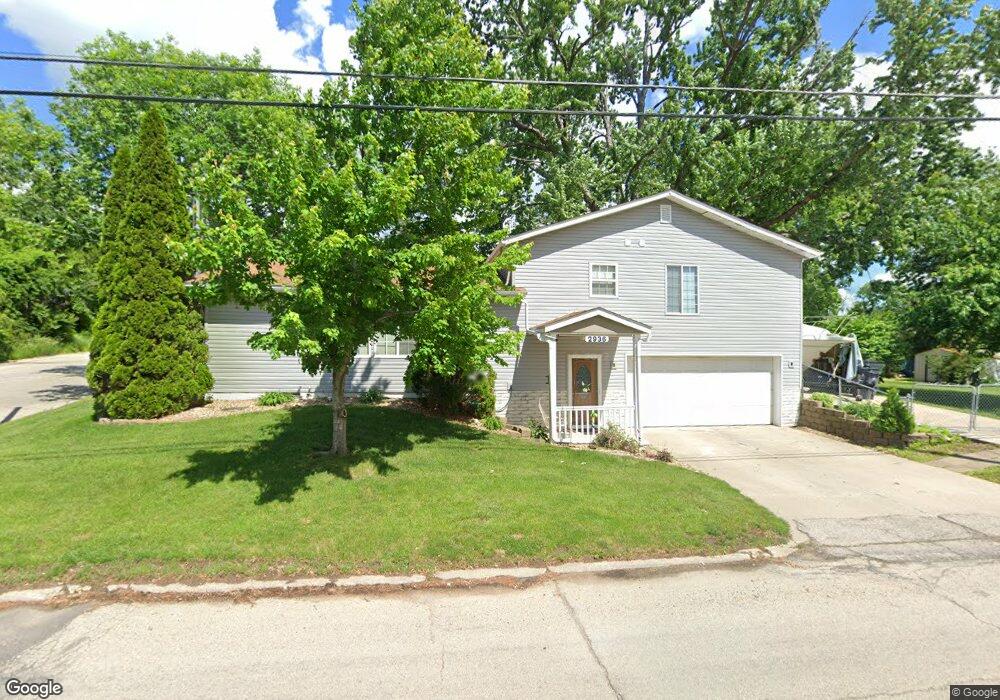
2936 Wenig Rd NE Cedar Rapids, IA 52402
Estimated Value: $226,000 - $268,000
4
Beds
3
Baths
1,356
Sq Ft
$179/Sq Ft
Est. Value
About This Home
This home is located at 2936 Wenig Rd NE, Cedar Rapids, IA 52402 and is currently estimated at $242,388, approximately $178 per square foot. 2936 Wenig Rd NE is a home located in Linn County with nearby schools including Pierce Elementary School, Franklin Middle School, and John F. Kennedy High School.
Ownership History
Date
Name
Owned For
Owner Type
Purchase Details
Closed on
Jun 22, 2020
Sold by
Rodgers Trina L
Bought by
Carson Brian J
Current Estimated Value
Home Financials for this Owner
Home Financials are based on the most recent Mortgage that was taken out on this home.
Original Mortgage
$111,500
Outstanding Balance
$98,836
Interest Rate
3.2%
Mortgage Type
New Conventional
Estimated Equity
$143,552
Purchase Details
Closed on
May 25, 2006
Sold by
Becwar Brian D
Bought by
Carson Brian J and Rodgers Trina L
Home Financials for this Owner
Home Financials are based on the most recent Mortgage that was taken out on this home.
Original Mortgage
$111,600
Interest Rate
6.66%
Mortgage Type
Unknown
Purchase Details
Closed on
Jun 10, 1998
Sold by
Kemmann Rickey L and Kelly Wendy L M
Bought by
Kemmann Rickey L and Kelly Wendy L M
Create a Home Valuation Report for This Property
The Home Valuation Report is an in-depth analysis detailing your home's value as well as a comparison with similar homes in the area
Home Values in the Area
Average Home Value in this Area
Purchase History
| Date | Buyer | Sale Price | Title Company |
|---|---|---|---|
| Carson Brian J | -- | None Available | |
| Carson Brian J | $139,000 | None Available | |
| Kemmann Rickey L | -- | -- |
Source: Public Records
Mortgage History
| Date | Status | Borrower | Loan Amount |
|---|---|---|---|
| Open | Carson Brian J | $111,500 | |
| Previous Owner | Carson Brian J | $111,600 |
Source: Public Records
Tax History Compared to Growth
Tax History
| Year | Tax Paid | Tax Assessment Tax Assessment Total Assessment is a certain percentage of the fair market value that is determined by local assessors to be the total taxable value of land and additions on the property. | Land | Improvement |
|---|---|---|---|---|
| 2025 | $2,978 | $195,700 | $43,500 | $152,200 |
| 2024 | $3,106 | $192,600 | $39,400 | $153,200 |
| 2023 | $3,106 | $178,800 | $39,400 | $139,400 |
| 2022 | $3,076 | $156,100 | $35,300 | $120,800 |
| 2021 | $3,322 | $157,400 | $35,300 | $122,100 |
| 2020 | $3,322 | $159,200 | $31,100 | $128,100 |
| 2019 | $2,930 | $144,500 | $31,100 | $113,400 |
| 2018 | $2,842 | $144,500 | $31,100 | $113,400 |
| 2017 | $2,835 | $135,500 | $31,100 | $104,400 |
| 2016 | $2,835 | $133,400 | $31,100 | $102,300 |
| 2015 | $2,633 | $123,715 | $24,883 | $98,832 |
| 2014 | $2,448 | $123,715 | $24,883 | $98,832 |
| 2013 | $2,390 | $123,715 | $24,883 | $98,832 |
Source: Public Records
Map
Nearby Homes
- 1759 Applewood Place NE
- 1724 Applewood Place NE
- 1724 Pikes Peak Ct NE Unit C
- 1585 Matterhorn Dr NE
- 3100 Blue Ridge Ct NE
- 3008 Circle Hill Ct NE
- 618 J Ave NE
- 664 J Ave NE Unit A
- 2445 Glass Rd NE
- 2962 Circle Dr NE
- 310 McKinsie Ct NE
- 2113 Linmar Dr NE
- 2041 Birchwood Dr NE
- 2226 Sierra Cir NE
- 2219 Sierra Cir NE
- 2202 Sierra Cir NE
- 2100 Knollshire Rd NE
- 2213 Sierra Cir NE
- 2207 Sierra Cir NE
- 2122 Sierra Cir NE
- 2357 Coldstream Ave NE
- 2930 Wenig Rd NE
- 2341 Coldstream Ave NE
- 2925 Applewood Place NE
- 2907 Applewood Place NE Unit 2A
- 2348 Coldstream Ave NE
- 2909 Applewood Place NE Unit 2B
- 2923 Applewood Place NE
- 2922 Wenig Rd NE
- 2911 Applewood Place NE
- 2915 Applewood Place NE Unit 2D
- 2921 Applewood Place NE Unit 1B
- 2919 Applewood Place NE
- 2910 Wenig Rd NE
- 2327 Coldstream Ave NE
- 2338 Coldstream Ave NE
- 3015 Wenig Rd NE
- 2332 Coldstream Ave NE
- 2326 Coldstream Ave NE
- 2500 Wenig Rd NE