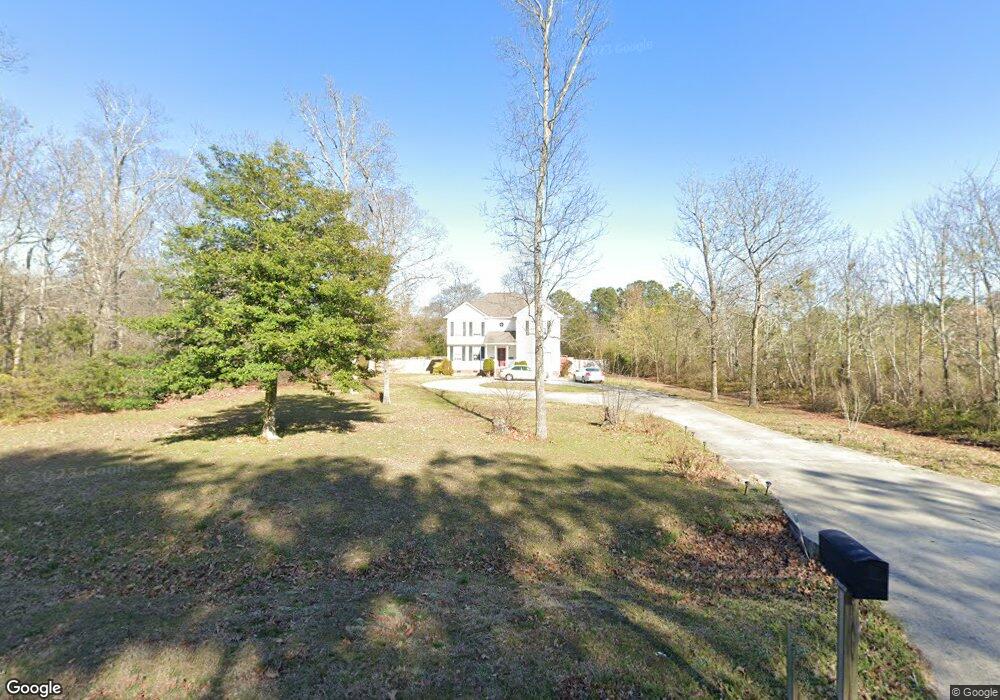
29369 Stuarts Way Cape Charles, VA 23310
Estimated Value: $370,000 - $441,893
4
Beds
3
Baths
2,224
Sq Ft
$178/Sq Ft
Est. Value
About This Home
This home is located at 29369 Stuarts Way, Cape Charles, VA 23310 and is currently estimated at $395,223, approximately $177 per square foot. 29369 Stuarts Way is a home located in Northampton County with nearby schools including Northampton High School.
Ownership History
Date
Name
Owned For
Owner Type
Purchase Details
Closed on
Sep 3, 2020
Sold by
Snook Mark A and Snook Christine C
Bought by
Smith Patricia D
Current Estimated Value
Home Financials for this Owner
Home Financials are based on the most recent Mortgage that was taken out on this home.
Original Mortgage
$223,200
Outstanding Balance
$198,075
Interest Rate
2.9%
Mortgage Type
New Conventional
Estimated Equity
$197,148
Purchase Details
Closed on
Aug 31, 2009
Sold by
Manuel Development Corporation
Bought by
Snook Mark A and Snook Christine C
Home Financials for this Owner
Home Financials are based on the most recent Mortgage that was taken out on this home.
Original Mortgage
$181,600
Interest Rate
5.25%
Mortgage Type
New Conventional
Purchase Details
Closed on
Jun 7, 2007
Sold by
Hmac Llc
Bought by
Manuel Development Corp
Create a Home Valuation Report for This Property
The Home Valuation Report is an in-depth analysis detailing your home's value as well as a comparison with similar homes in the area
Home Values in the Area
Average Home Value in this Area
Purchase History
| Date | Buyer | Sale Price | Title Company |
|---|---|---|---|
| Smith Patricia D | $279,000 | Attorney | |
| Snook Mark A | $227,000 | None Available | |
| Manuel Development Corp | -- | None Available |
Source: Public Records
Mortgage History
| Date | Status | Borrower | Loan Amount |
|---|---|---|---|
| Open | Smith Patricia D | $223,200 | |
| Previous Owner | Snook Mark A | $181,600 |
Source: Public Records
Tax History Compared to Growth
Tax History
| Year | Tax Paid | Tax Assessment Tax Assessment Total Assessment is a certain percentage of the fair market value that is determined by local assessors to be the total taxable value of land and additions on the property. | Land | Improvement |
|---|---|---|---|---|
| 2024 | $2,784 | $406,400 | $83,000 | $323,400 |
| 2023 | $2,205 | $290,100 | $52,900 | $237,200 |
| 2022 | $2,205 | $290,100 | $52,900 | $237,200 |
| 2021 | $2,022 | $242,100 | $43,800 | $198,300 |
| 2020 | $2,022 | $242,100 | $43,800 | $198,300 |
| 2019 | $2,007 | $241,800 | $39,000 | $202,800 |
| 2018 | $2,007 | $241,800 | $39,000 | $202,800 |
| 2017 | $1,986 | $241,800 | $39,000 | $202,800 |
| 2016 | $1,986 | $239,300 | $40,000 | $199,300 |
| 2015 | -- | $239,300 | $40,000 | $199,300 |
| 2011 | -- | $366,500 | $133,000 | $233,500 |
Source: Public Records
Map
Nearby Homes
- 4172 West Dr
- 4172 West Dr Unit 6
- 000 Lucilles Ln Unit 75
- Lot X Butler's Bluff Dr Unit Lot X
- 5036 Magotha Rd
- 28208 Arlington Rd Unit 96
- 0 Arlington Rd Unit 5 64026
- lot 50 Blueberry Dr Unit 50
- 0 Bluff Ln Unit n/a
- 27302 Walnut Grove Ln
- 27409 Blueberry Dr
- 3243 3 Doggett Ln
- 4564 Capeville Dr
- 5120 Hortense Ln
- 0 Cheapside Rd Unit A 51784
- 27520 Allure Way
- 27212 Castle Row
- 3134 Sapphire Ct
- 27192 Castle Row
- 27151 Castle Row
- 29369 Stuart's Way
- 0 Stuart's Way Unit 28 51293
- 0 Stuart's Way Unit 27 51292
- 29376 Stuart's Way
- 29375 Stuarts Way
- 29375 Stuart's Way
- 12 Stuart's Way
- 4211 Kiptopeke Dr
- 29392 Stuart's Way
- 29362 Stuart's Way
- 4265 Kiptopeke Dr
- 29392 Stuarts Way
- 29324 Stuarts Way
- 4223 Kiptopeke Dr
- 29335 Stuarts Way
- 4255 Kiptopeke Dr
- 4247 Kiptopeke Dr
- 29406 Stuart's Way
- 4269 Kiptopeke Dr
- 4182 West Dr