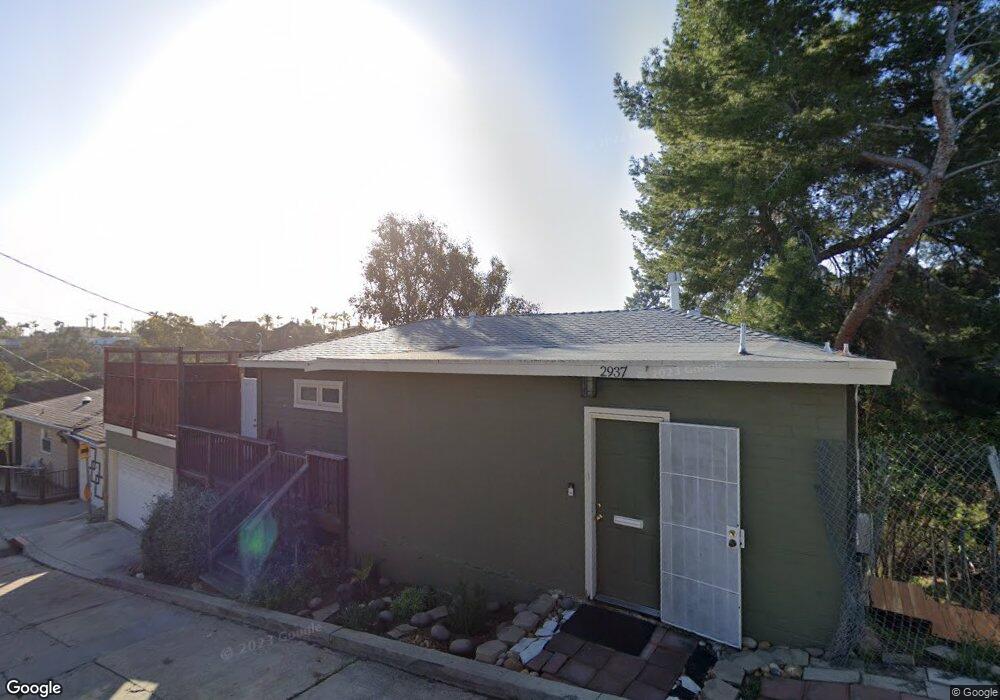
2937 Nutmeg St San Diego, CA 92104
North Park NeighborhoodEstimated Value: $1,020,022 - $1,357,000
2
Beds
1
Bath
895
Sq Ft
$1,323/Sq Ft
Est. Value
About This Home
This home is located at 2937 Nutmeg St, San Diego, CA 92104 and is currently estimated at $1,184,256, approximately $1,323 per square foot. 2937 Nutmeg St is a home located in San Diego County with nearby schools including McKinley Elementary School, Roosevelt International Middle School, and Mcgill School Of Success.
Ownership History
Date
Name
Owned For
Owner Type
Purchase Details
Closed on
Mar 31, 1998
Sold by
Porter Mindy
Bought by
Weinroth Richard Paul
Current Estimated Value
Home Financials for this Owner
Home Financials are based on the most recent Mortgage that was taken out on this home.
Original Mortgage
$132,000
Interest Rate
7.13%
Purchase Details
Closed on
Oct 8, 1997
Sold by
Porter Mark A
Bought by
Porter Mindy
Purchase Details
Closed on
Oct 7, 1997
Sold by
Tanke Anita A and Tanke Audrey F
Bought by
Porter Mindy
Create a Home Valuation Report for This Property
The Home Valuation Report is an in-depth analysis detailing your home's value as well as a comparison with similar homes in the area
Home Values in the Area
Average Home Value in this Area
Purchase History
| Date | Buyer | Sale Price | Title Company |
|---|---|---|---|
| Weinroth Richard Paul | $165,000 | Fidelity National Title | |
| Porter Mindy | -- | Fidelity National Title Co | |
| Porter Mindy | $93,000 | Fidelity National Title |
Source: Public Records
Mortgage History
| Date | Status | Borrower | Loan Amount |
|---|---|---|---|
| Previous Owner | Weinroth Richard Paul | $132,000 |
Source: Public Records
Tax History Compared to Growth
Tax History
| Year | Tax Paid | Tax Assessment Tax Assessment Total Assessment is a certain percentage of the fair market value that is determined by local assessors to be the total taxable value of land and additions on the property. | Land | Improvement |
|---|---|---|---|---|
| 2025 | $3,153 | $263,436 | $175,629 | $87,807 |
| 2024 | $3,153 | $258,272 | $172,186 | $86,086 |
| 2023 | $3,080 | $253,209 | $168,810 | $84,399 |
| 2022 | $2,996 | $248,245 | $165,500 | $82,745 |
| 2021 | $2,972 | $243,378 | $162,255 | $81,123 |
| 2020 | $2,935 | $240,884 | $160,592 | $80,292 |
| 2019 | $2,882 | $236,162 | $157,444 | $78,718 |
| 2018 | $2,695 | $231,532 | $154,357 | $77,175 |
| 2017 | $80 | $226,993 | $151,331 | $75,662 |
| 2016 | $2,584 | $222,543 | $148,364 | $74,179 |
| 2015 | $2,545 | $219,201 | $146,136 | $73,065 |
| 2014 | $2,504 | $214,908 | $143,274 | $71,634 |
Source: Public Records
Map
Nearby Homes