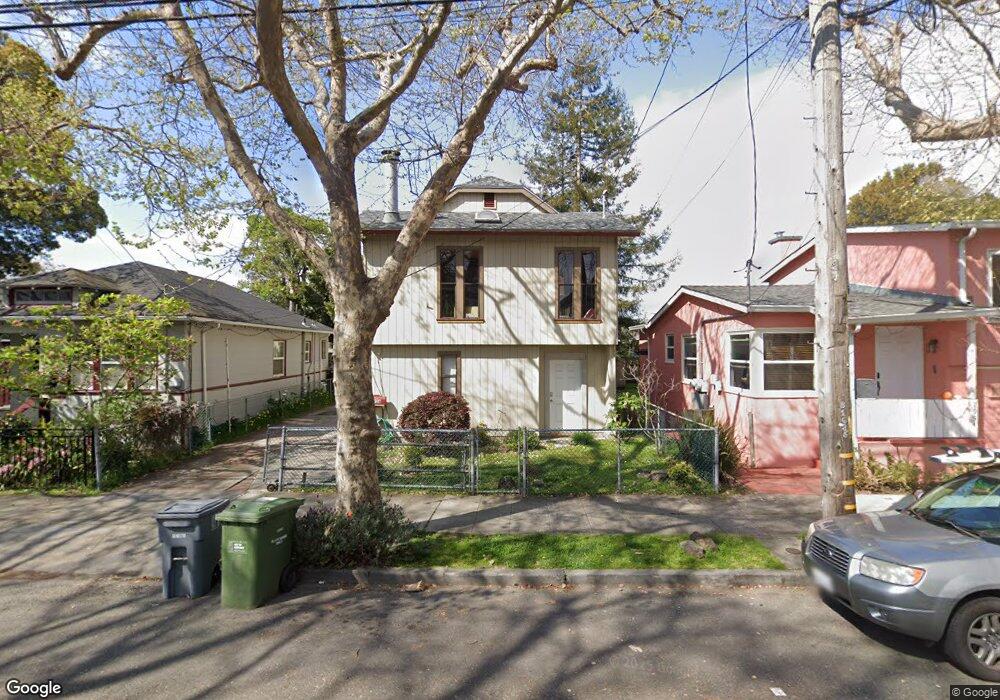
2938 King St Berkeley, CA 94703
South Berkeley NeighborhoodEstimated Value: $1,160,000 - $1,463,000
3
Beds
2
Baths
1,989
Sq Ft
$661/Sq Ft
Est. Value
About This Home
This home is located at 2938 King St, Berkeley, CA 94703 and is currently estimated at $1,315,487, approximately $661 per square foot. 2938 King St is a home located in Alameda County with nearby schools including Malcolm X Elementary School, Emerson Elementary School, and John Muir Elementary School.
Ownership History
Date
Name
Owned For
Owner Type
Purchase Details
Closed on
Jul 9, 2025
Sold by
Revocable Clifton and Revocable Marjorie Jackson
Bought by
Jackson Clifton E
Current Estimated Value
Home Financials for this Owner
Home Financials are based on the most recent Mortgage that was taken out on this home.
Original Mortgage
$653,760
Outstanding Balance
$649,690
Interest Rate
6.67%
Mortgage Type
VA
Estimated Equity
$665,797
Purchase Details
Closed on
Aug 2, 2019
Sold by
Jackson Clifton E
Bought by
Jackson Clifton
Home Financials for this Owner
Home Financials are based on the most recent Mortgage that was taken out on this home.
Interest Rate
3.75%
Create a Home Valuation Report for This Property
The Home Valuation Report is an in-depth analysis detailing your home's value as well as a comparison with similar homes in the area
Home Values in the Area
Average Home Value in this Area
Purchase History
| Date | Buyer | Sale Price | Title Company |
|---|---|---|---|
| Jackson Clifton E | -- | Wfg Lender Services | |
| Jackson Clifton E | -- | Wfg Lender Services | |
| Jackson Clifton | -- | -- |
Source: Public Records
Mortgage History
| Date | Status | Borrower | Loan Amount |
|---|---|---|---|
| Open | Jackson Clifton E | $653,760 | |
| Previous Owner | Jackson Clifton | -- |
Source: Public Records
Tax History
| Year | Tax Paid | Tax Assessment Tax Assessment Total Assessment is a certain percentage of the fair market value that is determined by local assessors to be the total taxable value of land and additions on the property. | Land | Improvement |
|---|---|---|---|---|
| 2025 | $6,466 | $217,716 | $90,155 | $127,561 |
| 2024 | $6,466 | $213,448 | $88,388 | $125,060 |
| 2023 | $6,257 | $209,263 | $86,655 | $122,608 |
| 2022 | $6,251 | $205,160 | $84,956 | $120,204 |
| 2021 | $6,229 | $201,137 | $83,290 | $117,847 |
| 2020 | $5,833 | $199,075 | $82,436 | $116,639 |
| 2019 | $5,513 | $195,172 | $80,820 | $114,352 |
| 2018 | $5,368 | $191,345 | $79,235 | $112,110 |
| 2017 | $5,156 | $187,594 | $77,682 | $109,912 |
| 2016 | $4,897 | $183,917 | $76,159 | $107,758 |
| 2015 | $4,804 | $181,154 | $75,015 | $106,139 |
| 2014 | $4,717 | $177,607 | $73,546 | $104,061 |
Source: Public Records
Map
Nearby Homes
- 1646 Ashby Ave
- 2926 Ellis St
- 1535 Julia St
- 3110 California St
- 3114 California St
- 1530 Stuart St
- 1507 Prince St
- 3101 Sacramento St
- 2922 Stanton St
- 3138 California St
- 2790 Sacramento St
- 2782 Sacramento St
- 2774 Sacramento St
- 2758 Sacramento St
- 2750 Sacramento St
- 1450 Ward St
- 3214 California St
- 2701 Grant St
- 1612 Carleton St
- 3233 Ellis St
Your Personal Tour Guide
Ask me questions while you tour the home.