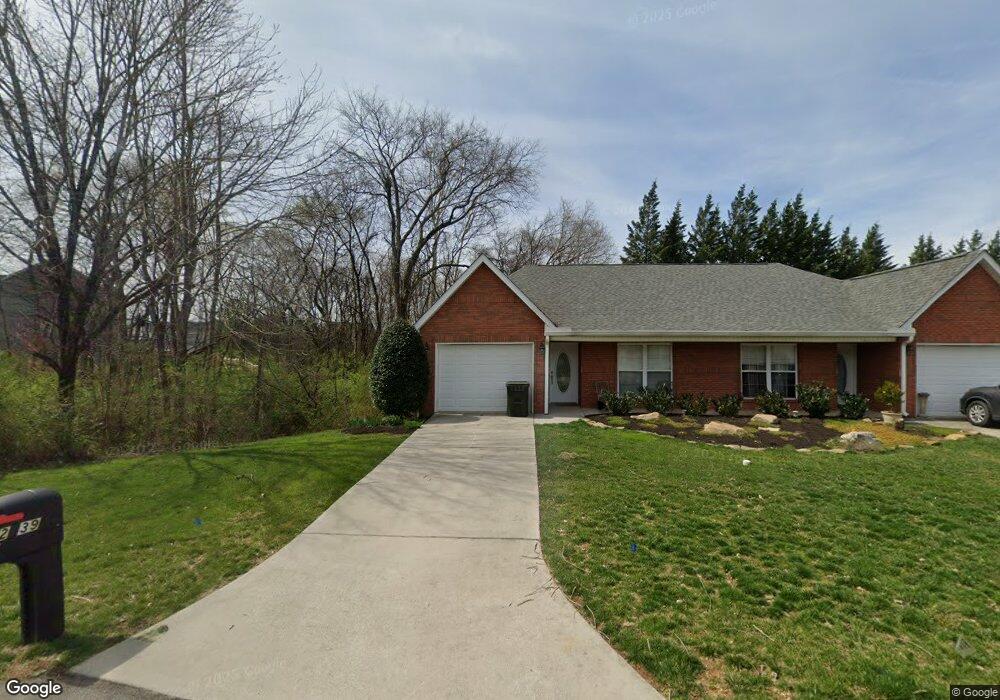
2939 Dominion Dr Unit 3 Maryville, TN 37803
Estimated Value: $307,000 - $319,000
2
Beds
2
Baths
1,248
Sq Ft
$251/Sq Ft
Est. Value
About This Home
This home is located at 2939 Dominion Dr Unit 3, Maryville, TN 37803 and is currently estimated at $313,041, approximately $250 per square foot. 2939 Dominion Dr Unit 3 is a home located in Blount County with nearby schools including Carpenters Elementary School, Carpenters Middle School, and Heritage High School.
Ownership History
Date
Name
Owned For
Owner Type
Purchase Details
Closed on
Mar 16, 2022
Sold by
Clark Houser James
Bought by
Potter Judy Ann and Potter Charles Robert
Current Estimated Value
Home Financials for this Owner
Home Financials are based on the most recent Mortgage that was taken out on this home.
Original Mortgage
$192,000
Outstanding Balance
$178,923
Interest Rate
3.85%
Mortgage Type
New Conventional
Estimated Equity
$134,118
Purchase Details
Closed on
Jan 21, 2011
Sold by
Hammond Annette L
Bought by
Houser James C
Home Financials for this Owner
Home Financials are based on the most recent Mortgage that was taken out on this home.
Original Mortgage
$145,650
Interest Rate
4.79%
Purchase Details
Closed on
Sep 12, 2005
Sold by
Constructio Dominion Downs
Bought by
Hammond Annette L
Home Financials for this Owner
Home Financials are based on the most recent Mortgage that was taken out on this home.
Original Mortgage
$103,900
Interest Rate
5.86%
Create a Home Valuation Report for This Property
The Home Valuation Report is an in-depth analysis detailing your home's value as well as a comparison with similar homes in the area
Home Values in the Area
Average Home Value in this Area
Purchase History
| Date | Buyer | Sale Price | Title Company |
|---|---|---|---|
| Potter Judy Ann | $240,000 | None Listed On Document | |
| Houser James C | $141,000 | -- | |
| Hammond Annette L | $129,900 | -- |
Source: Public Records
Mortgage History
| Date | Status | Borrower | Loan Amount |
|---|---|---|---|
| Open | Potter Judy Ann | $192,000 | |
| Previous Owner | Houser James C | $145,650 | |
| Previous Owner | Hammond Annette L | $103,900 |
Source: Public Records
Tax History Compared to Growth
Tax History
| Year | Tax Paid | Tax Assessment Tax Assessment Total Assessment is a certain percentage of the fair market value that is determined by local assessors to be the total taxable value of land and additions on the property. | Land | Improvement |
|---|---|---|---|---|
| 2025 | $1,032 | $64,925 | $0 | $0 |
| 2024 | $1,032 | $64,925 | $12,500 | $52,425 |
| 2023 | $1,032 | $64,925 | $12,500 | $52,425 |
| 2022 | $947 | $38,350 | $8,750 | $29,600 |
| 2021 | $947 | $38,350 | $8,750 | $29,600 |
| 2020 | $947 | $38,350 | $8,750 | $29,600 |
| 2019 | $947 | $38,350 | $8,750 | $29,600 |
| 2018 | $819 | $33,175 | $6,875 | $26,300 |
| 2017 | $819 | $33,175 | $6,875 | $26,300 |
| 2016 | $819 | $33,175 | $6,875 | $26,300 |
| 2015 | $713 | $33,175 | $6,875 | $26,300 |
| 2014 | $753 | $33,175 | $6,875 | $26,300 |
| 2013 | $753 | $35,000 | $0 | $0 |
Source: Public Records
Map
Nearby Homes
- 3017 Yearling Ln
- Craig Plan at Best Farms
- Aria Plan at Best Farms
- Cali Plan at Best Farms
- Hayden Plan at Best Farms
- Penwell Plan at Best Farms
- Hanover Plan at Best Farms
- Salem Plan at Best Farms
- Belhaven Plan at Best Farms
- 2537 Keeneland Dr
- 2511 Keeneland Dr
- 2746 Farmhouse Dr
- 2811 Best Rd
- 3207 Song Sparrow Dr
- 3209 Song Sparrow Dr
- 3211 Song Sparrow Dr
- 3213 Song Sparrow Dr
- 3214 Song Sparrow Dr
- 3215 Song Sparrow Dr
- 3216 Song Sparrow Dr
- 2939 Dominion Dr
- 2937 Dominion Dr
- 2931 Dominion Dr
- 2929 Dominion Dr
- 2940 Dominion Dr
- 2942 Dominion Dr
- 3024 Yearling Ln
- 2945 Dominion Dr
- 2938 Dominion Dr
- 2936 Dominion Dr
- 2934 Dominion Dr
- 3022 Yearling Ln
- 2932 Dominion Dr
- 2923 Dominion Dr
- 3020 Yearling Ln
- 2930 Dominion Dr
- 3026 Yearling Ln
- 2949 Dominion Dr
- 2928 Dominion Dr
- 3028 Yearling Ln