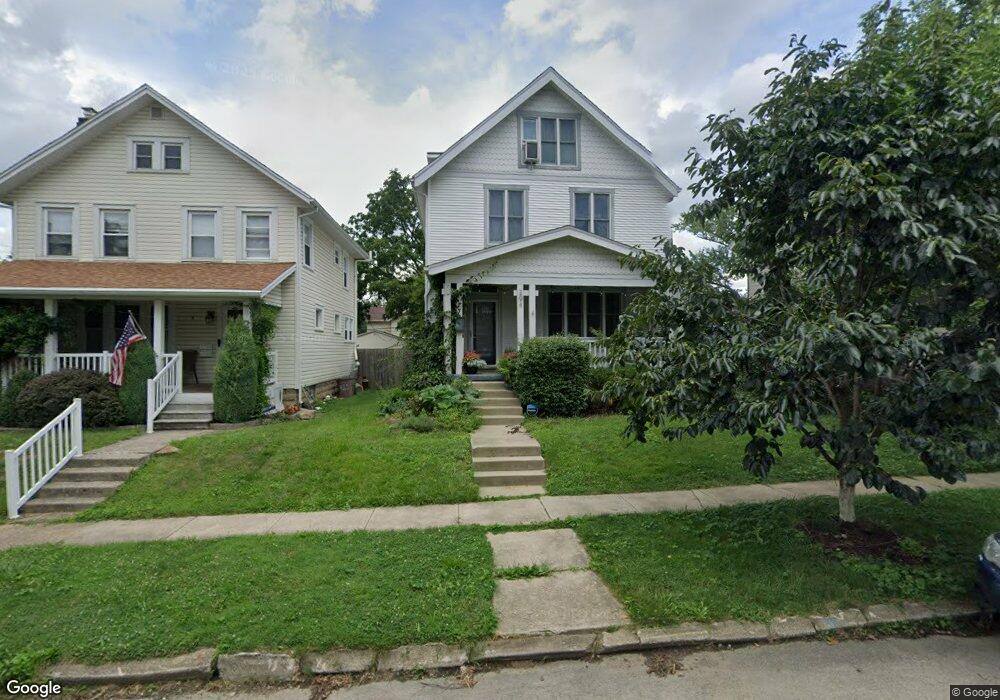
294 E Tulane Rd Columbus, OH 43202
Clintonville NeighborhoodEstimated Value: $416,157 - $545,000
3
Beds
3
Baths
1,800
Sq Ft
$263/Sq Ft
Est. Value
About This Home
This home is located at 294 E Tulane Rd, Columbus, OH 43202 and is currently estimated at $472,789, approximately $262 per square foot. 294 E Tulane Rd is a home located in Franklin County with nearby schools including Clinton Elementary School, Dominion Middle School, and Whetstone High School.
Ownership History
Date
Name
Owned For
Owner Type
Purchase Details
Closed on
Mar 21, 2011
Sold by
Schultz Terrance and Schultz Sandra
Bought by
Chambers Jason W and Yamada Aline Y
Current Estimated Value
Home Financials for this Owner
Home Financials are based on the most recent Mortgage that was taken out on this home.
Original Mortgage
$167,200
Outstanding Balance
$114,832
Interest Rate
5.09%
Mortgage Type
New Conventional
Estimated Equity
$357,957
Purchase Details
Closed on
Dec 23, 2010
Sold by
Schultz Bradley and Schultz Jennifer A
Bought by
Schultz Terrance and Schultz Sandra
Purchase Details
Closed on
Dec 9, 2008
Sold by
Nestinger Peter J and Nestinger Elizabeth J
Bought by
Schultz Terrance and Schultz Sandra
Purchase Details
Closed on
Sep 1, 1994
Sold by
Lindamood John B
Bought by
Peter J Nestinger
Home Financials for this Owner
Home Financials are based on the most recent Mortgage that was taken out on this home.
Original Mortgage
$81,700
Interest Rate
8.59%
Mortgage Type
New Conventional
Purchase Details
Closed on
Jun 24, 1991
Create a Home Valuation Report for This Property
The Home Valuation Report is an in-depth analysis detailing your home's value as well as a comparison with similar homes in the area
Home Values in the Area
Average Home Value in this Area
Purchase History
| Date | Buyer | Sale Price | Title Company |
|---|---|---|---|
| Chambers Jason W | $209,000 | Talon | |
| Schultz Terrance | -- | Talon Group | |
| Schultz Terrance | $212,000 | Talon Group | |
| Peter J Nestinger | $86,000 | -- | |
| -- | $72,000 | -- |
Source: Public Records
Mortgage History
| Date | Status | Borrower | Loan Amount |
|---|---|---|---|
| Open | Chambers Jason W | $167,200 | |
| Closed | Peter J Nestinger | $81,700 |
Source: Public Records
Tax History
| Year | Tax Paid | Tax Assessment Tax Assessment Total Assessment is a certain percentage of the fair market value that is determined by local assessors to be the total taxable value of land and additions on the property. | Land | Improvement |
|---|---|---|---|---|
| 2025 | $5,510 | $122,780 | $44,800 | $77,980 |
| 2024 | $5,510 | $122,780 | $44,800 | $77,980 |
| 2023 | $5,440 | $122,780 | $44,800 | $77,980 |
| 2022 | $5,537 | $106,750 | $33,110 | $73,640 |
| 2021 | $5,546 | $106,750 | $33,110 | $73,640 |
| 2020 | $5,554 | $106,750 | $33,110 | $73,640 |
| 2019 | $4,883 | $80,500 | $25,480 | $55,020 |
| 2018 | $4,693 | $80,500 | $25,480 | $55,020 |
| 2017 | $4,926 | $80,500 | $25,480 | $55,020 |
| 2016 | $4,971 | $75,040 | $24,640 | $50,400 |
| 2015 | $4,512 | $75,040 | $24,640 | $50,400 |
| 2014 | $4,523 | $75,040 | $24,640 | $50,400 |
| 2013 | $2,196 | $73,850 | $23,450 | $50,400 |
Source: Public Records
Map
Nearby Homes
- 415 E Weber Rd
- 2836-2838 Indianola Ave Unit 2836
- 2804 Indianola Ave
- 2771 Indianola Ave
- 2785 Kensington Place W
- 296 Walhalla Rd
- 366 Parkview Dr Unit 366
- 521 Melrose Ave
- 2717 Hibbert Ave
- 555 E Weber Rd
- 29 Crestview Rd
- 53 Olentangy St
- 99 E Pacemont Rd
- 415 Glen Echo Cir
- 580 Crestview Rd
- 45 E California Ave
- 109 E Arcadia Ave
- 10 E Weber Rd Unit 402
- 74 E Dodridge St
- 3021 N High St
Your Personal Tour Guide
Ask me questions while you tour the home.