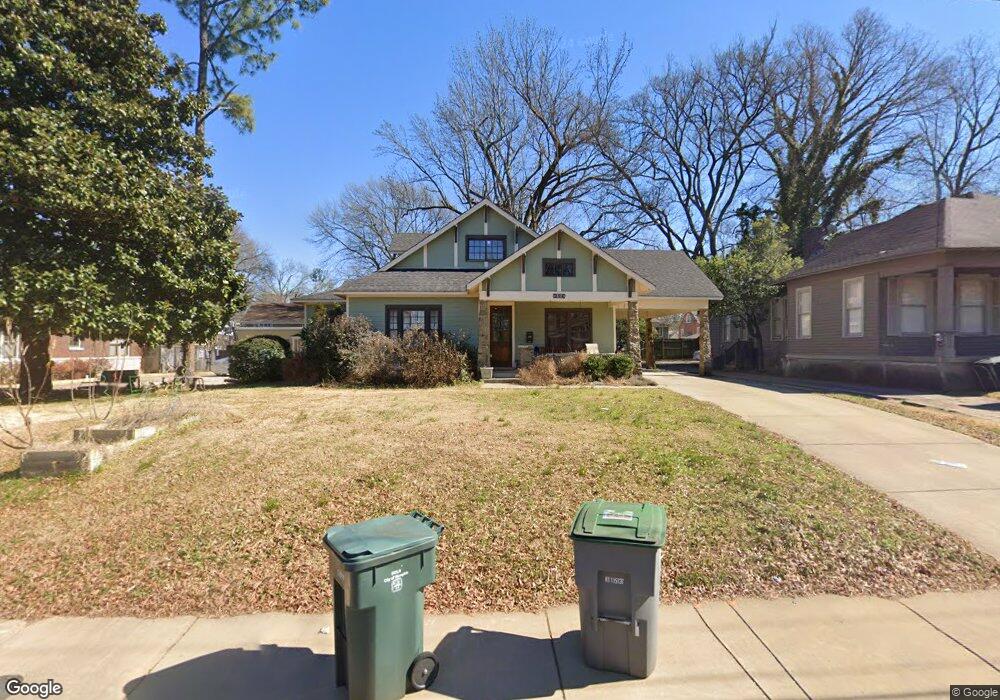
294 N Mclean Blvd Memphis, TN 38112
Midtown Memphis NeighborhoodEstimated Value: $350,167 - $396,000
2
Beds
2
Baths
2,520
Sq Ft
$148/Sq Ft
Est. Value
About This Home
This home is located at 294 N Mclean Blvd, Memphis, TN 38112 and is currently estimated at $373,042, approximately $148 per square foot. 294 N Mclean Blvd is a home located in Shelby County with nearby schools including Snowden Elementary/Middle School, Central High School, and Crosstown High School.
Ownership History
Date
Name
Owned For
Owner Type
Purchase Details
Closed on
Feb 28, 2011
Sold by
Mouron Marisol Ramos
Bought by
Mouron Christopher Garrett
Current Estimated Value
Purchase Details
Closed on
May 24, 2002
Sold by
Bragg Julia S
Bought by
Mouron Christopher G and Mouron Marisol Ramos
Home Financials for this Owner
Home Financials are based on the most recent Mortgage that was taken out on this home.
Original Mortgage
$121,500
Outstanding Balance
$50,511
Interest Rate
6.85%
Estimated Equity
$322,531
Purchase Details
Closed on
Sep 22, 1998
Sold by
Mladsi Scott W and Mladsi Tamara A
Bought by
Bragg John J and Barsotti Andrea
Home Financials for this Owner
Home Financials are based on the most recent Mortgage that was taken out on this home.
Original Mortgage
$91,120
Interest Rate
6.96%
Create a Home Valuation Report for This Property
The Home Valuation Report is an in-depth analysis detailing your home's value as well as a comparison with similar homes in the area
Home Values in the Area
Average Home Value in this Area
Purchase History
| Date | Buyer | Sale Price | Title Company |
|---|---|---|---|
| Mouron Christopher Garrett | -- | None Available | |
| Mouron Christopher G | $135,000 | -- | |
| Bragg John J | $114,900 | Transcontinental Title Compa | |
| Bragg John J | $114,900 | Transcontinental Title Compa |
Source: Public Records
Mortgage History
| Date | Status | Borrower | Loan Amount |
|---|---|---|---|
| Open | Mouron Christopher G | $121,500 | |
| Previous Owner | Bragg John J | $91,120 |
Source: Public Records
Tax History Compared to Growth
Tax History
| Year | Tax Paid | Tax Assessment Tax Assessment Total Assessment is a certain percentage of the fair market value that is determined by local assessors to be the total taxable value of land and additions on the property. | Land | Improvement |
|---|---|---|---|---|
| 2025 | $3,009 | $96,700 | $22,800 | $73,900 |
| 2024 | $3,009 | $88,750 | $15,575 | $73,175 |
| 2023 | $5,406 | $88,750 | $15,575 | $73,175 |
| 2022 | $5,406 | $88,750 | $15,575 | $73,175 |
| 2021 | $5,470 | $88,750 | $15,575 | $73,175 |
| 2020 | $4,871 | $67,225 | $15,575 | $51,650 |
| 2019 | $4,871 | $67,225 | $15,575 | $51,650 |
| 2018 | $4,871 | $67,225 | $15,575 | $51,650 |
| 2017 | $2,763 | $67,225 | $15,575 | $51,650 |
| 2016 | $2,076 | $47,500 | $0 | $0 |
| 2014 | $2,076 | $47,500 | $0 | $0 |
Source: Public Records
Map
Nearby Homes
- 334 N Mclean Blvd
- 1757 Carruthers Place
- 1747 Lawrence Ave
- 155 N Tucker St
- 156 N Tucker St
- 1680 Carruthers Place
- 1 Belleair Dr
- 144 N Auburndale St
- 141 N Auburndale St
- 1781 Forrest Ave
- 286 Angelus St
- 1867 Jefferson Ave
- 84 N Mclean Blvd
- 122 N Evergreen St
- 1817 N Parkway
- 279 Angelus St
- 108 N Belvedere Blvd Unit 33
- 108 N Belvedere Blvd Unit 22
- 108 N Belvedere Blvd Unit 34
- 108 N Belvedere Blvd Unit 18
- 300 N Mclean Blvd
- 288 N Mclean Blvd Unit 2
- 288 N Mclean Blvd Unit 1
- 288 N Mclean Blvd
- 304 N Mclean Blvd
- 282 N Mclean Blvd
- 312 N Mclean Blvd
- 295 Buena Vista Place
- 278 N Mclean Blvd
- 289 Buena Vista Place
- 303 Buena Vista Place
- 285 Buena Vista Place
- 289 N Mclean Blvd
- 285 N Mclean Blvd
- 274 N Mclean Blvd
- 311 Buena Vista Place
- 318 N Mclean Blvd
- 279 Buena Vista Place
- 275 Buena Vista Place
- 279 N Mclean Blvd