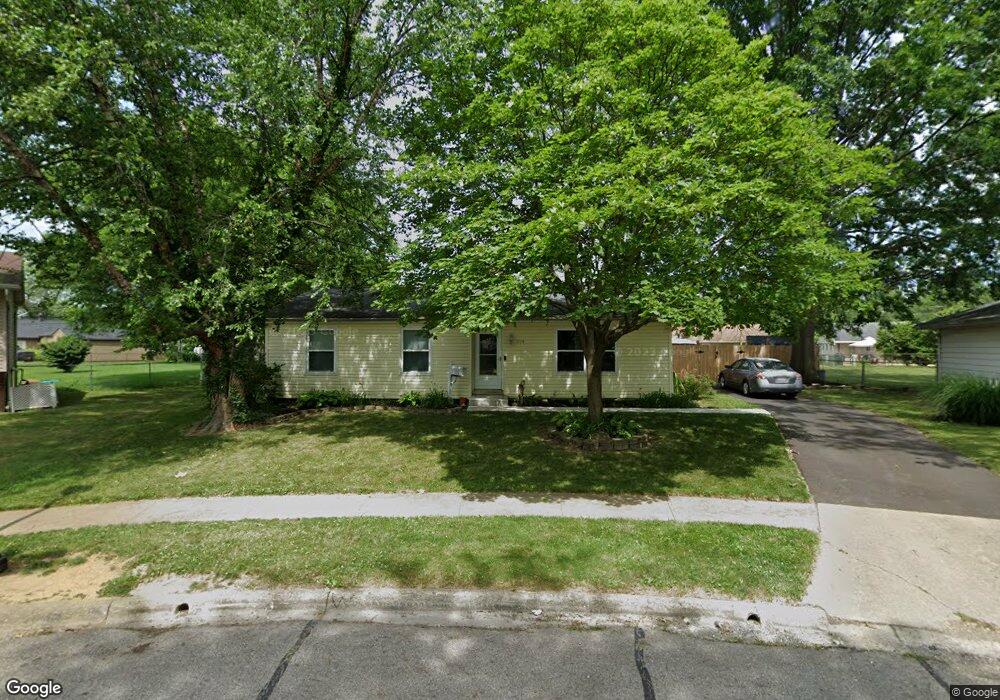
294 Penny Ln Columbus, OH 43230
Estimated Value: $177,000 - $299,000
4
Beds
2
Baths
1,254
Sq Ft
$205/Sq Ft
Est. Value
About This Home
This home is located at 294 Penny Ln, Columbus, OH 43230 and is currently estimated at $257,221, approximately $205 per square foot. 294 Penny Ln is a home located in Franklin County with nearby schools including Royal Manor Elementary School, Gahanna West Middle School, and Lincoln High School.
Ownership History
Date
Name
Owned For
Owner Type
Purchase Details
Closed on
Mar 24, 2020
Sold by
Ridinger Stacy L and Anderson Christopher W
Bought by
Ridinger Stacy L and Anderson Christopher W
Current Estimated Value
Home Financials for this Owner
Home Financials are based on the most recent Mortgage that was taken out on this home.
Original Mortgage
$135,000
Outstanding Balance
$119,787
Interest Rate
3.6%
Mortgage Type
New Conventional
Estimated Equity
$137,434
Purchase Details
Closed on
Aug 30, 2001
Sold by
Woods Elizabeth L and Woods Elizabeth L
Bought by
Ridinger Stacy L
Home Financials for this Owner
Home Financials are based on the most recent Mortgage that was taken out on this home.
Original Mortgage
$76,000
Interest Rate
7.03%
Mortgage Type
Purchase Money Mortgage
Purchase Details
Closed on
Nov 3, 1983
Bought by
Woods Elizabeth L
Create a Home Valuation Report for This Property
The Home Valuation Report is an in-depth analysis detailing your home's value as well as a comparison with similar homes in the area
Home Values in the Area
Average Home Value in this Area
Purchase History
| Date | Buyer | Sale Price | Title Company |
|---|---|---|---|
| Ridinger Stacy L | -- | None Available | |
| Ridinger Stacy L | $80,000 | Lawyers Title | |
| Woods Elizabeth L | -- | -- |
Source: Public Records
Mortgage History
| Date | Status | Borrower | Loan Amount |
|---|---|---|---|
| Open | Ridinger Stacy L | $135,000 | |
| Closed | Ridinger Stacy L | $76,000 |
Source: Public Records
Tax History Compared to Growth
Tax History
| Year | Tax Paid | Tax Assessment Tax Assessment Total Assessment is a certain percentage of the fair market value that is determined by local assessors to be the total taxable value of land and additions on the property. | Land | Improvement |
|---|---|---|---|---|
| 2024 | $4,493 | $76,270 | $26,180 | $50,090 |
| 2023 | $4,437 | $76,265 | $26,180 | $50,085 |
| 2022 | $3,968 | $53,130 | $14,700 | $38,430 |
| 2021 | $3,837 | $53,130 | $14,700 | $38,430 |
| 2020 | $3,805 | $53,130 | $14,700 | $38,430 |
| 2019 | $3,183 | $44,350 | $12,250 | $32,100 |
| 2018 | $2,941 | $44,350 | $12,250 | $32,100 |
| 2017 | $2,820 | $44,350 | $12,250 | $32,100 |
| 2016 | $2,719 | $37,590 | $10,290 | $27,300 |
| 2015 | $2,721 | $37,590 | $10,290 | $27,300 |
| 2014 | $2,700 | $37,590 | $10,290 | $27,300 |
| 2013 | $1,341 | $37,590 | $10,290 | $27,300 |
Source: Public Records
Map
Nearby Homes
- 221 Lincolnshire Rd
- 2741 Acarie Dr
- 4093 Adalric Dr
- 463 Lincolnshire Rd
- 2694 Kantian Dr
- 4131 Claver Dr
- 343 Imperial Dr
- 668 Kenilworth Ct
- 2851 Acarie Dr
- 600 Agler Rd
- 3888 Agler Rd
- 0 Stelzer Rd Unit L 225022351
- 209 Imperial Dr
- 470 Deerwood Ave E
- 404 Foxwood Dr
- 3784 Armuth Ave
- 2423 Stelzer Rd
- 464 Foxwood Dr
- 0 E Minnesota Ave Unit 224018641
- 2275 Stelzer Rd
- 298 Penny Ln
- 290 Penny Ln
- 299 Lincolnshire Rd
- 305 Lincolnshire Rd
- 293 Lincolnshire Rd
- 323 Amesbury Dr
- 325 Amesbury Dr
- 302 Penny Ln
- 286 Penny Ln
- 313 Lincolnshire Rd
- 327 Amesbury Dr
- 291 Penny Ln
- 287 Lincolnshire Rd
- 329 Amesbury Dr
- 280 Penny Ln
- 279 Lincolnshire Rd
- 283 Penny Ln
- 306 Penny Ln
- 304 Lincolnshire Rd
- 295 Penny Ln