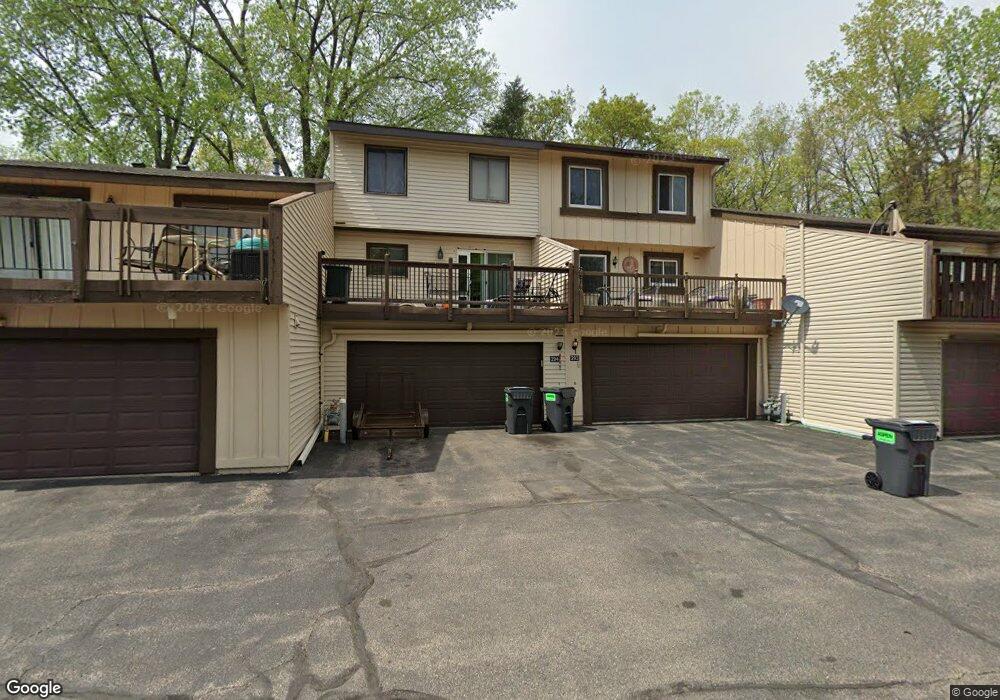
294 River Woods Ln Burnsville, MN 55337
Estimated Value: $239,000 - $259,000
3
Beds
2
Baths
1,240
Sq Ft
$200/Sq Ft
Est. Value
About This Home
This home is located at 294 River Woods Ln, Burnsville, MN 55337 and is currently estimated at $247,668, approximately $199 per square foot. 294 River Woods Ln is a home located in Dakota County with nearby schools including William Byrne Elementary School, Burnsville High School, and Gateway STEM Academy.
Ownership History
Date
Name
Owned For
Owner Type
Purchase Details
Closed on
Jan 15, 2015
Sold by
Noboa Jose I and Noboa Erin
Bought by
Hinrichs Stacy J
Current Estimated Value
Home Financials for this Owner
Home Financials are based on the most recent Mortgage that was taken out on this home.
Original Mortgage
$128,250
Interest Rate
3.92%
Mortgage Type
New Conventional
Purchase Details
Closed on
Aug 15, 2011
Sold by
Nygaard Paulette A and Morrison Aubie J
Bought by
Noboa Jose I
Home Financials for this Owner
Home Financials are based on the most recent Mortgage that was taken out on this home.
Original Mortgage
$77,972
Interest Rate
4.5%
Mortgage Type
FHA
Purchase Details
Closed on
Aug 4, 2003
Sold by
Swanson Judith A
Bought by
Nygaard Paulette A and Monson Aubre J
Purchase Details
Closed on
Oct 28, 1999
Sold by
Bang Diette J
Bought by
Swanson Judith A
Purchase Details
Closed on
May 15, 1998
Sold by
Hansen Richard P and Hansen Kay L
Bought by
Bang Dietle J
Create a Home Valuation Report for This Property
The Home Valuation Report is an in-depth analysis detailing your home's value as well as a comparison with similar homes in the area
Home Values in the Area
Average Home Value in this Area
Purchase History
| Date | Buyer | Sale Price | Title Company |
|---|---|---|---|
| Hinrichs Stacy J | $135,000 | First American Title Co | |
| Noboa Jose I | $80,000 | Bankers Title | |
| Nygaard Paulette A | $155,000 | -- | |
| Swanson Judith A | $112,900 | -- | |
| Bang Dietle J | $97,550 | -- |
Source: Public Records
Mortgage History
| Date | Status | Borrower | Loan Amount |
|---|---|---|---|
| Previous Owner | Hinrichs Stacy J | $128,250 | |
| Previous Owner | Noboa Jose I | $77,972 |
Source: Public Records
Tax History Compared to Growth
Tax History
| Year | Tax Paid | Tax Assessment Tax Assessment Total Assessment is a certain percentage of the fair market value that is determined by local assessors to be the total taxable value of land and additions on the property. | Land | Improvement |
|---|---|---|---|---|
| 2024 | $2,314 | $229,100 | $39,900 | $189,200 |
| 2023 | $2,314 | $232,600 | $40,000 | $192,600 |
| 2022 | $1,954 | $226,100 | $39,900 | $186,200 |
| 2021 | $1,852 | $197,400 | $34,700 | $162,700 |
| 2020 | $1,786 | $180,000 | $30,700 | $149,300 |
| 2019 | $1,783 | $168,900 | $29,200 | $139,700 |
| 2018 | $1,673 | $161,600 | $27,000 | $134,600 |
| 2017 | $1,622 | $149,200 | $25,000 | $124,200 |
| 2016 | $1,516 | $144,000 | $23,800 | $120,200 |
| 2015 | $1,331 | $106,640 | $18,662 | $87,978 |
| 2014 | -- | $96,830 | $17,083 | $79,747 |
| 2013 | -- | $77,537 | $14,211 | $63,326 |
Source: Public Records
Map
Nearby Homes
- 319 River Woods Ln
- 221 River Woods Ln
- 247 River Woods Ln
- 188 River Woods Ln
- 145 River Woods Ln
- 146 River Woods Ln
- 3309 Red Oak Cir N
- 72 River Woods Ln
- 55 River Woods Ln
- 4632 Westwood Ln
- 11902 River Hills Cir
- 4774 Slater Rd
- 11921 Baypoint Dr
- 11900 Highland View Cir
- 12625 Sable Dr
- 12640 Tiffany Ct
- 2400 E 125th St
- 2300 Villaburne Ct W
- 3017 Mcleod St
- 12232 Oak Leaf Cir
- 293 River Woods Ln
- 292 River Woods Ln
- 295 River Woods Ln
- 275 River Woods Ln
- 276 River Woods Ln
- 274 River Woods Ln
- 277 River Woods Ln
- 296 River Woods Ln
- 297 River Woods Ln
- 298 River Woods Ln
- 291 River Woods Ln
- 299 River Woods Ln
- 326 River Woods Ln
- 290 River Woods Ln
- 327 River Woods Ln
- 300 River Woods Ln
- 328 River Woods Ln
- 279 River Woods Ln
- 301 River Woods Ln
- 329 River Woods Ln