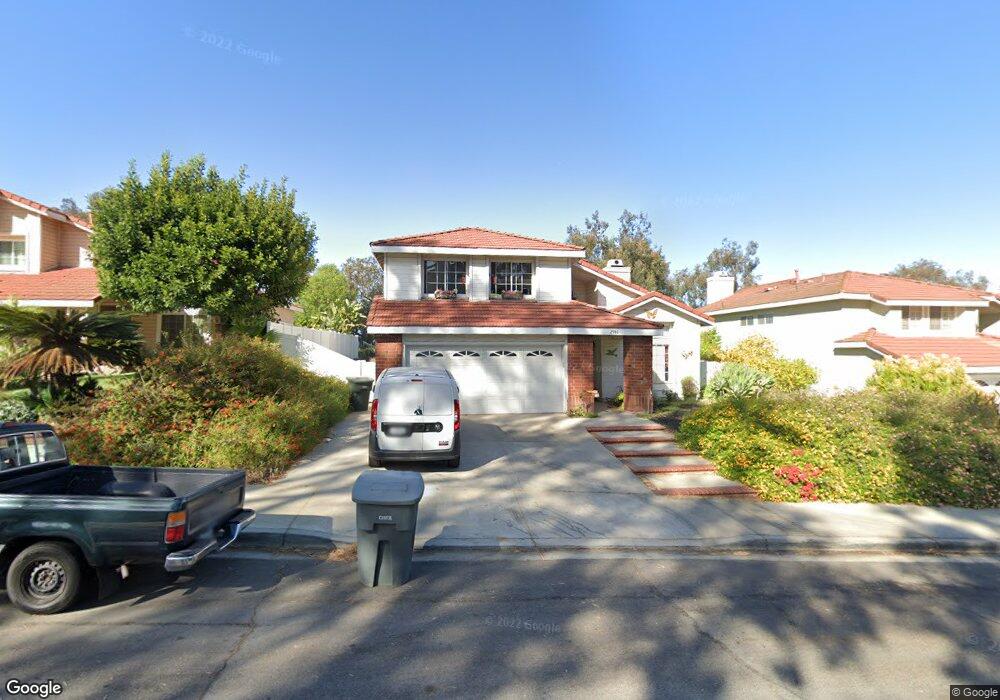
2940 Little Oak Way Chino Hills, CA 91709
South Chino Hills NeighborhoodEstimated Value: $1,036,287 - $1,138,000
4
Beds
3
Baths
2,240
Sq Ft
$481/Sq Ft
Est. Value
About This Home
This home is located at 2940 Little Oak Way, Chino Hills, CA 91709 and is currently estimated at $1,078,322, approximately $481 per square foot. 2940 Little Oak Way is a home located in San Bernardino County with nearby schools including Oak Ridge Elementary School, Robert O. Townsend Junior High School, and Chino Hills High School.
Ownership History
Date
Name
Owned For
Owner Type
Purchase Details
Closed on
Mar 31, 2017
Sold by
Xu Fu Yun and Guo Jie
Bought by
Xu Fu Yun and Guo Jie
Current Estimated Value
Purchase Details
Closed on
Nov 1, 2010
Sold by
Little Oak Trust #2940
Bought by
Xu Fu Yun and Guo Jie
Purchase Details
Closed on
Dec 17, 2009
Sold by
Widjaja Channy K
Bought by
Little Oak Trust #2940 and Galileo Financial
Purchase Details
Closed on
Sep 3, 1998
Sold by
Chang Chengkuo and Ruey Chi
Bought by
Widjaja Channy K
Home Financials for this Owner
Home Financials are based on the most recent Mortgage that was taken out on this home.
Original Mortgage
$128,000
Interest Rate
6.54%
Mortgage Type
Stand Alone First
Purchase Details
Closed on
Aug 25, 1994
Sold by
Chang Andrew Cheng Wei
Bought by
Chang Cheng Kuo Everett and Chang Ruey Chi
Create a Home Valuation Report for This Property
The Home Valuation Report is an in-depth analysis detailing your home's value as well as a comparison with similar homes in the area
Home Values in the Area
Average Home Value in this Area
Purchase History
| Date | Buyer | Sale Price | Title Company |
|---|---|---|---|
| Xu Fu Yun | -- | None Available | |
| Xu Fu Yun | $448,000 | First American Title Company | |
| Little Oak Trust #2940 | -- | None Available | |
| Widjaja Channy K | -- | Investors Title Company | |
| Chang Cheng Kuo Everett | -- | Fidelity National Title Ins |
Source: Public Records
Mortgage History
| Date | Status | Borrower | Loan Amount |
|---|---|---|---|
| Previous Owner | Widjaja Channy K | $128,000 | |
| Closed | Widjaja Channy K | $24,000 |
Source: Public Records
Tax History Compared to Growth
Tax History
| Year | Tax Paid | Tax Assessment Tax Assessment Total Assessment is a certain percentage of the fair market value that is determined by local assessors to be the total taxable value of land and additions on the property. | Land | Improvement |
|---|---|---|---|---|
| 2025 | $6,727 | $573,969 | $201,145 | $372,824 |
| 2024 | $6,727 | $562,715 | $197,201 | $365,514 |
| 2023 | $6,555 | $551,681 | $193,334 | $358,347 |
| 2022 | $6,519 | $540,864 | $189,543 | $351,321 |
| 2021 | $6,402 | $530,258 | $185,826 | $344,432 |
| 2020 | $6,326 | $524,821 | $183,921 | $340,900 |
| 2019 | $6,224 | $514,531 | $180,315 | $334,216 |
| 2018 | $6,098 | $504,442 | $176,779 | $327,663 |
| 2017 | $5,998 | $494,551 | $173,313 | $321,238 |
| 2016 | $5,637 | $484,854 | $169,915 | $314,939 |
| 2015 | $5,534 | $477,571 | $167,363 | $310,208 |
| 2014 | $5,988 | $468,216 | $164,085 | $304,131 |
Source: Public Records
Map
Nearby Homes
- 0 Valle Vista Dr
- 15520 Ficus St
- 3107 Morningside Dr
- 15531 Oakflats Rd
- 3027 Spyglass Ct
- 15526 Oakhurst St
- 15358 Morningside Dr
- 3099 Oaktrail Rd
- 15413 Oakgrove Ct
- 2918 Crape Myrtle Cir
- 15507 Oakdale Rd
- 15770 Pistachio St
- 3072 Crape Myrtle Cir
- 15740 Willow Run Dr
- 15050 Avenida de Las Flores
- 15036 Calle la Paloma
- 2702 Avenida Marguerite
- 3150 Oakcrest Dr
- 15429 Turquoise Cir N
- 14797 Maplewood Dr
- 2934 Little Oak Way
- 2946 Little Oak Way
- 2928 Little Oak Way
- 2952 Little Oak Way
- 15471 Quiet Oak Dr
- 15446 Quiet Oak Dr
- 15465 Quiet Oak Dr
- 15477 Quiet Oak Dr
- 15458 Quiet Oak Dr
- 15464 Quiet Oak Dr
- 15483 Quiet Oak Dr
- 15474 Ficus St
- 15470 Ficus St
- 15470 Quiet Oak Dr
- 15478 Ficus St
- 15489 Quiet Oak Dr
- 15482 Ficus St
- 15482 Quiet Oak Dr
- 15486 Ficus St
- 15462 Ficus St