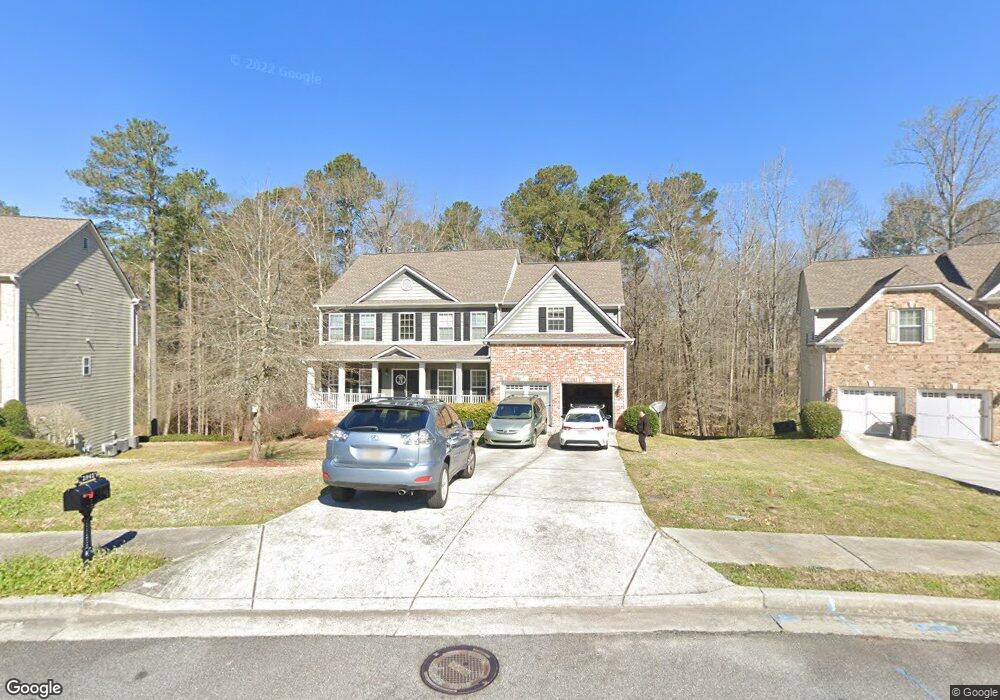
2940 Maple Springs Ct Marietta, GA 30064
West Cobb NeighborhoodEstimated Value: $562,000 - $634,000
4
Beds
4
Baths
3,468
Sq Ft
$170/Sq Ft
Est. Value
About This Home
This home is located at 2940 Maple Springs Ct, Marietta, GA 30064 and is currently estimated at $591,263, approximately $170 per square foot. 2940 Maple Springs Ct is a home located in Cobb County with nearby schools including Dowell Elementary School, Lovinggood Middle School, and Hillgrove High School.
Ownership History
Date
Name
Owned For
Owner Type
Purchase Details
Closed on
Nov 22, 2010
Sold by
Carbajal Ines E
Bought by
Carbajal Ines E and Islam Mohammed
Current Estimated Value
Home Financials for this Owner
Home Financials are based on the most recent Mortgage that was taken out on this home.
Original Mortgage
$187,500
Outstanding Balance
$2,817
Interest Rate
4.31%
Mortgage Type
New Conventional
Estimated Equity
$588,446
Purchase Details
Closed on
Apr 30, 2008
Sold by
Suntrust Mortgage Inc
Bought by
Carbajal Ines E
Home Financials for this Owner
Home Financials are based on the most recent Mortgage that was taken out on this home.
Original Mortgage
$191,900
Interest Rate
5.82%
Mortgage Type
New Conventional
Purchase Details
Closed on
Apr 1, 2008
Sold by
Robinson Jamie L and Robinson Wendy K
Bought by
Suntrust Mortgage Inc
Home Financials for this Owner
Home Financials are based on the most recent Mortgage that was taken out on this home.
Original Mortgage
$191,900
Interest Rate
5.82%
Mortgage Type
New Conventional
Create a Home Valuation Report for This Property
The Home Valuation Report is an in-depth analysis detailing your home's value as well as a comparison with similar homes in the area
Home Values in the Area
Average Home Value in this Area
Purchase History
| Date | Buyer | Sale Price | Title Company |
|---|---|---|---|
| Carbajal Ines E | -- | -- | |
| Carbajal Ines E | $239,900 | -- | |
| Suntrust Mortgage Inc | $275,000 | -- |
Source: Public Records
Mortgage History
| Date | Status | Borrower | Loan Amount |
|---|---|---|---|
| Open | Carbajal Ines E | $187,500 | |
| Previous Owner | Carbajal Ines E | $191,900 |
Source: Public Records
Tax History Compared to Growth
Tax History
| Year | Tax Paid | Tax Assessment Tax Assessment Total Assessment is a certain percentage of the fair market value that is determined by local assessors to be the total taxable value of land and additions on the property. | Land | Improvement |
|---|---|---|---|---|
| 2025 | $5,985 | $207,648 | $32,000 | $175,648 |
| 2024 | $5,989 | $207,648 | $32,000 | $175,648 |
| 2023 | $6,261 | $207,648 | $32,000 | $175,648 |
| 2022 | $4,458 | $146,880 | $28,000 | $118,880 |
| 2021 | $4,458 | $146,880 | $28,000 | $118,880 |
| 2020 | $4,255 | $140,200 | $28,000 | $112,200 |
| 2019 | $4,255 | $140,200 | $28,000 | $112,200 |
| 2018 | $3,958 | $130,420 | $20,000 | $110,420 |
| 2017 | $3,750 | $130,420 | $20,000 | $110,420 |
| 2016 | $3,170 | $110,268 | $20,000 | $90,268 |
| 2015 | $2,971 | $100,864 | $20,000 | $80,864 |
| 2014 | $2,997 | $100,864 | $0 | $0 |
Source: Public Records
Map
Nearby Homes
- 3119 Plainsman Dr
- 2715 Byess Ct
- 2722 Byess Ct
- 2723 Byess Ct
- 3130 Plainsman Dr
- Dunning Plan at Oak Valley Estates
- Presley Plan at Oak Valley Estates
- Downing Plan at Oak Valley Estates
- Hedgerow Plan at Oak Valley Estates
- Abney Plan at Oak Valley Estates
- Sherwood Plan at Oak Valley Estates
- Chatfield Plan at Oak Valley Estates
- Bramblewood Plan at Oak Valley Estates
- 2960 MacLand Rd SW
- 3001 Ashland Ct SW
- 3354 Hannah Ct
- 1853 Edington Rd SW
- 2335 Corbett Ct
- 1884 Dovonshire Rd SW
- 1765 Dew Place
- 2930 Maple Springs Ct
- 2950 Maple Springs Ct
- 2920 Maple Springs Ct
- 2960 Maple Springs Ct
- 2925 Maple Springs Ct
- 2955 Maple Springs Ct
- 2970 Maple Springs Ct
- 2980 Maple Springs Ct
- 2985 Maple Springs Ct
- 4758 Maple Springs Ct
- 4752 Maple Springs Ct
- 2990 Maple Springs Ct
- 2890 Maple Springs Ct
- 2880 Maple Springs Ct
- 2905 Maple Springs Ct
- 3000 Maple Springs Ct
- 2944 Alan Dr SW
- 2895 Maple Springs Ct
- 2930 Alan Dr SW
- 2885 Maple Springs Ct