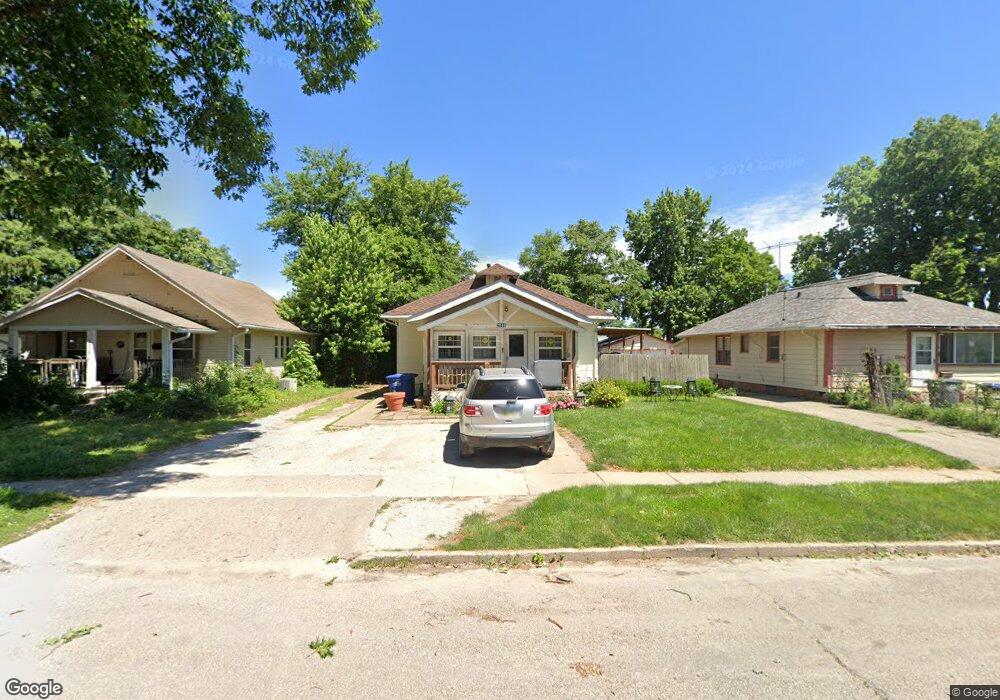
2940 Maple St Des Moines, IA 50317
Fairground NeighborhoodEstimated Value: $149,000 - $171,000
3
Beds
1
Bath
972
Sq Ft
$165/Sq Ft
Est. Value
About This Home
This home is located at 2940 Maple St, Des Moines, IA 50317 and is currently estimated at $160,024, approximately $164 per square foot. 2940 Maple St is a home located in Polk County with nearby schools including Willard Elementary School, Hoyt Middle School, and East High School.
Ownership History
Date
Name
Owned For
Owner Type
Purchase Details
Closed on
Apr 11, 2005
Sold by
Sparks Russell L and Kern Kerri M
Bought by
Rivas Octavio and Rivas Roxana
Current Estimated Value
Home Financials for this Owner
Home Financials are based on the most recent Mortgage that was taken out on this home.
Original Mortgage
$60,800
Outstanding Balance
$32,622
Interest Rate
6.5%
Mortgage Type
Fannie Mae Freddie Mac
Estimated Equity
$127,402
Purchase Details
Closed on
Aug 6, 1998
Sold by
Walters David W and Walters Jody M
Bought by
Sparks Russell L and Sparks Kerri M
Home Financials for this Owner
Home Financials are based on the most recent Mortgage that was taken out on this home.
Original Mortgage
$42,250
Interest Rate
7.03%
Create a Home Valuation Report for This Property
The Home Valuation Report is an in-depth analysis detailing your home's value as well as a comparison with similar homes in the area
Home Values in the Area
Average Home Value in this Area
Purchase History
| Date | Buyer | Sale Price | Title Company |
|---|---|---|---|
| Rivas Octavio | $63,500 | -- | |
| Sparks Russell L | $44,000 | -- | |
| Walters David W | -- | -- |
Source: Public Records
Mortgage History
| Date | Status | Borrower | Loan Amount |
|---|---|---|---|
| Open | Rivas Octavio | $60,800 | |
| Previous Owner | Sparks Russell L | $42,250 |
Source: Public Records
Tax History
| Year | Tax Paid | Tax Assessment Tax Assessment Total Assessment is a certain percentage of the fair market value that is determined by local assessors to be the total taxable value of land and additions on the property. | Land | Improvement |
|---|---|---|---|---|
| 2025 | $2,144 | $139,900 | $27,500 | $112,400 |
| 2024 | $2,144 | $119,500 | $23,400 | $96,100 |
| 2023 | $2,010 | $119,500 | $23,400 | $96,100 |
| 2022 | $1,994 | $94,200 | $19,200 | $75,000 |
| 2021 | $1,830 | $94,200 | $19,200 | $75,000 |
| 2020 | $1,894 | $81,900 | $16,800 | $65,100 |
| 2019 | $1,668 | $81,900 | $16,800 | $65,100 |
| 2018 | $1,646 | $70,600 | $14,500 | $56,100 |
| 2017 | $1,568 | $70,600 | $14,500 | $56,100 |
| 2016 | $1,522 | $66,500 | $13,500 | $53,000 |
| 2015 | $1,522 | $66,500 | $13,500 | $53,000 |
| 2014 | $1,528 | $66,200 | $13,400 | $52,800 |
Source: Public Records
Map
Nearby Homes
- 2925 Walker St
- 2916 Walker St
- 822 E 29th St
- 2832 Lyon St
- 2825 Maple St
- 2907 Des Moines St
- 2814 Des Moines St
- 3113 State Ave
- 903 E 27th Ct
- 2805 Des Moines St
- 2736 Des Moines St
- 3121 Mahaska Ave
- 2743 Des Moines St
- 2936 E Walnut St
- 2638 E Grand Ave
- 2912 Cleveland Ave
- 2722 Chicago Ave
- 2812 Cleveland Ave
- 3253 Dubuque Ave
- 1257 E 33rd St
Your Personal Tour Guide
Ask me questions while you tour the home.