Estimated Value: $394,000 - $794,656
--
Bed
1
Bath
1,904
Sq Ft
$308/Sq Ft
Est. Value
About This Home
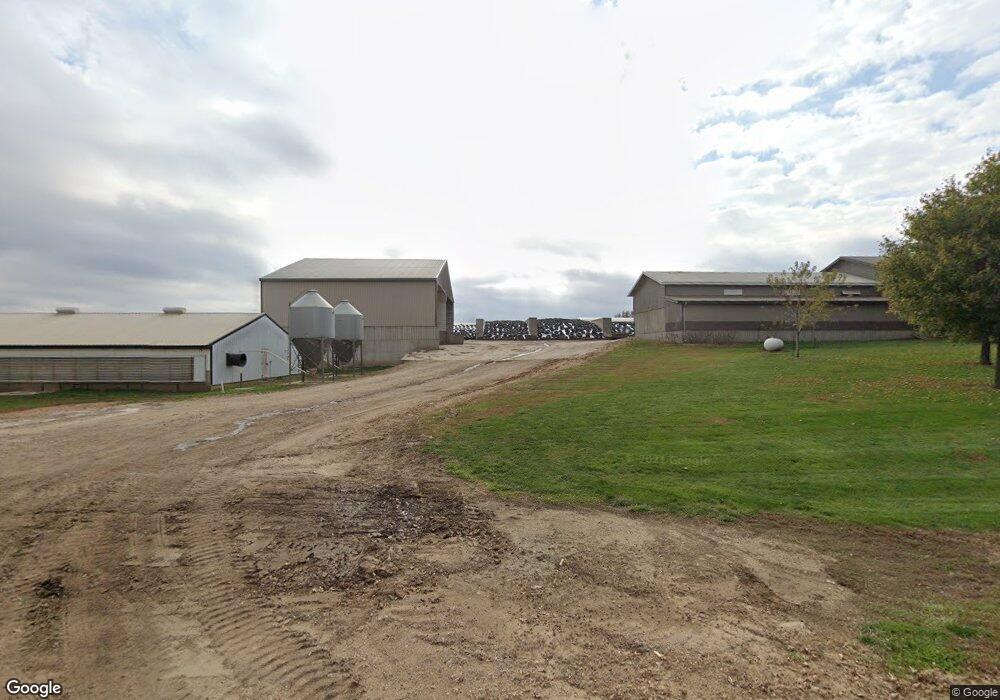
This home is located at 2941 320th St, Hull, IA 51239 and is currently estimated at $586,914, approximately $308 per square foot. 2941 320th St is a home located in Sioux County with nearby schools including Boyden-Hull Elementary School, Boyden-Hull High School, and Hull Protestant Reformed Christian School.
Ownership History
Date
Name
Owned For
Owner Type
Purchase Details
Closed on
Oct 31, 2023
Sold by
Loren E De Jager Revocable Trust and Sandra M De Jager Revocable Trust
Bought by
Dejager Zachary and De Jager Jamie
Current Estimated Value
Purchase Details
Closed on
Aug 11, 2005
Sold by
Dejager Brent De and De Jager Amy C
Bought by
Dejager Loren E and Jager Sandra M
Home Financials for this Owner
Home Financials are based on the most recent Mortgage that was taken out on this home.
Original Mortgage
$522,923
Interest Rate
5.82%
Mortgage Type
FHA
Purchase Details
Closed on
Jul 23, 2005
Sold by
Weide Debra Vander and Vander Weide Debra Renee
Bought by
Dejager Loren E and Dejager Sandra M
Home Financials for this Owner
Home Financials are based on the most recent Mortgage that was taken out on this home.
Original Mortgage
$522,923
Interest Rate
5.82%
Mortgage Type
FHA
Create a Home Valuation Report for This Property
The Home Valuation Report is an in-depth analysis detailing your home's value as well as a comparison with similar homes in the area
Home Values in the Area
Average Home Value in this Area
Purchase History
| Date | Buyer | Sale Price | Title Company |
|---|---|---|---|
| Dejager Zachary | -- | None Listed On Document | |
| Dejager Zachary | -- | None Listed On Document | |
| Dejager Loren E | $172,000 | None Available | |
| Dejager Loren E | $288,500 | None Available |
Source: Public Records
Mortgage History
| Date | Status | Borrower | Loan Amount |
|---|---|---|---|
| Previous Owner | Dejager Loren E | $522,923 | |
| Previous Owner | Dejager Loren E | $522,923 |
Source: Public Records
Tax History Compared to Growth
Tax History
| Year | Tax Paid | Tax Assessment Tax Assessment Total Assessment is a certain percentage of the fair market value that is determined by local assessors to be the total taxable value of land and additions on the property. | Land | Improvement |
|---|---|---|---|---|
| 2025 | $5,896 | $527,560 | $41,730 | $485,830 |
| 2024 | $5,896 | $466,670 | $33,310 | $433,360 |
| 2023 | $5,940 | $473,230 | $33,310 | $439,920 |
| 2022 | $4,652 | $330,530 | $25,100 | $305,430 |
| 2021 | $4,392 | $324,170 | $27,180 | $296,990 |
| 2020 | $4,392 | $294,310 | $27,050 | $267,260 |
| 2019 | $3,758 | $301,700 | $39,140 | $262,560 |
| 2018 | $3,694 | $301,700 | $39,140 | $262,560 |
| 2017 | $3,694 | $301,700 | $39,140 | $262,560 |
| 2014 | $3,758 | $350,720 | $0 | $0 |
Source: Public Records
Map
Nearby Homes