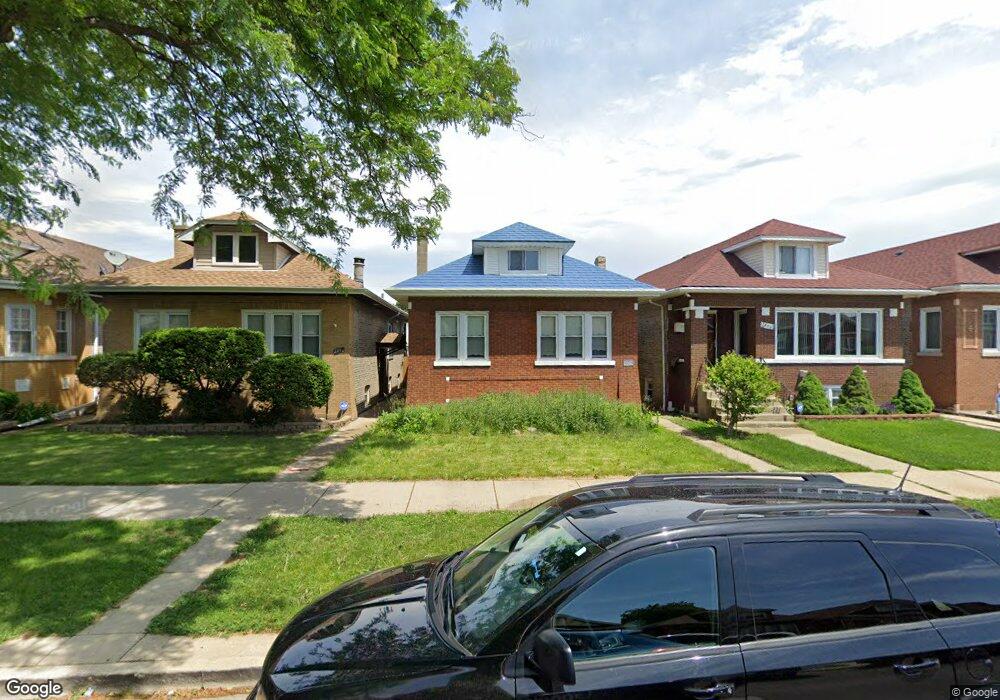
2941 N Major Ave Chicago, IL 60634
Belmont Central NeighborhoodEstimated Value: $344,000 - $445,000
2
Beds
1
Bath
1,075
Sq Ft
$356/Sq Ft
Est. Value
About This Home
This home is located at 2941 N Major Ave, Chicago, IL 60634 and is currently estimated at $382,174, approximately $355 per square foot. 2941 N Major Ave is a home located in Cook County with nearby schools including Schubert Elementary School, Northwest Middle School, and Steinmetz College Prep.
Ownership History
Date
Name
Owned For
Owner Type
Purchase Details
Closed on
Jan 14, 2011
Sold by
Hornkohl Jennifer R and Byrne James P
Bought by
Hornkohl Jennifer R and Jennifer R Hornkohl Trust
Current Estimated Value
Purchase Details
Closed on
Sep 25, 1998
Sold by
Byrne James P and Hornkohl Jennifer
Bought by
Byrne James P and Hornkohl Jennifer R
Home Financials for this Owner
Home Financials are based on the most recent Mortgage that was taken out on this home.
Original Mortgage
$22,600
Interest Rate
7.1%
Purchase Details
Closed on
Mar 25, 1998
Sold by
Nowak Alfred
Bought by
Byrne James P and Hornkohl Jennifer
Home Financials for this Owner
Home Financials are based on the most recent Mortgage that was taken out on this home.
Original Mortgage
$120,183
Outstanding Balance
$22,122
Interest Rate
7.09%
Estimated Equity
$360,052
Create a Home Valuation Report for This Property
The Home Valuation Report is an in-depth analysis detailing your home's value as well as a comparison with similar homes in the area
Home Values in the Area
Average Home Value in this Area
Purchase History
| Date | Buyer | Sale Price | Title Company |
|---|---|---|---|
| Hornkohl Jennifer R | -- | None Available | |
| Byrne James P | -- | Valley Title Company | |
| Byrne James P | $124,000 | -- |
Source: Public Records
Mortgage History
| Date | Status | Borrower | Loan Amount |
|---|---|---|---|
| Closed | Byrne James P | $22,600 | |
| Open | Byrne James P | $120,183 |
Source: Public Records
Tax History Compared to Growth
Tax History
| Year | Tax Paid | Tax Assessment Tax Assessment Total Assessment is a certain percentage of the fair market value that is determined by local assessors to be the total taxable value of land and additions on the property. | Land | Improvement |
|---|---|---|---|---|
| 2024 | $4,156 | $27,000 | $11,532 | $15,468 |
| 2023 | $4,029 | $23,000 | $9,300 | $13,700 |
| 2022 | $4,029 | $23,000 | $9,300 | $13,700 |
| 2021 | $3,958 | $23,000 | $9,300 | $13,700 |
| 2020 | $3,712 | $19,756 | $4,650 | $15,106 |
| 2019 | $3,773 | $22,198 | $4,650 | $17,548 |
| 2018 | $3,708 | $22,198 | $4,650 | $17,548 |
| 2017 | $3,417 | $19,239 | $4,092 | $15,147 |
| 2016 | $3,355 | $19,239 | $4,092 | $15,147 |
| 2015 | $3,366 | $20,981 | $4,092 | $16,889 |
| 2014 | $3,409 | $20,931 | $3,720 | $17,211 |
| 2013 | $3,331 | $20,931 | $3,720 | $17,211 |
Source: Public Records
Map
Nearby Homes
- 2859 N Mango Ave
- 3036 N Luna Ave
- 2939 N Lotus Ave
- 2735 N Mango Ave
- 3031 N Marmora Ave
- 3036 N Long Ave
- 2714 N Mango Ave
- 5505 W Parker Ave
- 2744 N Marmora Ave
- 2951 N Austin Ave
- 5335 W Barry Ave
- 5435 W Melrose St
- 5303 W George St
- 5512 W Wrightwood Ave
- 5254 W Wolfram St
- 5243 W Oakdale Ave
- 2632 N Marmora Ave
- 6014 W Fletcher St
- 5244 W Barry Ave
- 2531 N Major Ave
- 2937 N Major Ave
- 2943 N Major Ave
- 2935 N Major Ave
- 2947 N Major Ave
- 2931 N Major Ave
- 2949 N Major Ave
- 2929 N Major Ave
- 2953 N Major Ave
- 2940 N Parkside Ave
- 2942 N Parkside Ave
- 2936 N Parkside Ave
- 2925 N Major Ave
- 2957 N Major Ave
- 2946 N Parkside Ave
- 2932 N Parkside Ave
- 2959 N Major Ave
- 2948 N Parkside Ave
- 2930 N Parkside Ave
- 2923 N Major Ave
- 2952 N Parkside Ave Unit 2