Estimated Value: $430,000 - $457,000
3
Beds
3
Baths
2,051
Sq Ft
$214/Sq Ft
Est. Value
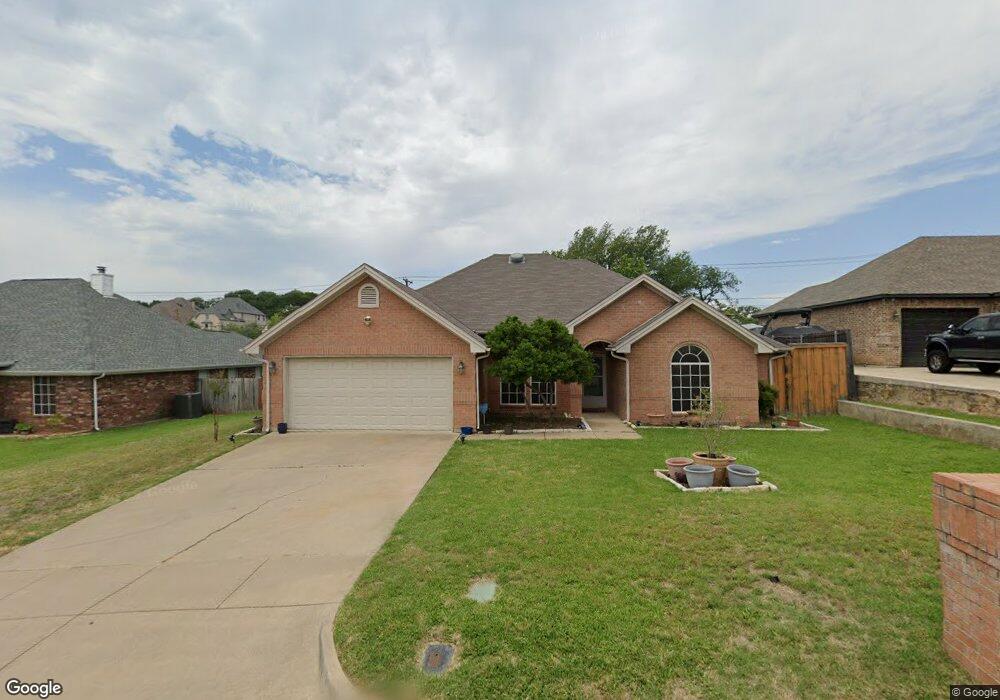
About This Home
This home is located at 2941 Oak Ridge Dr, Hurst, TX 76054 and is currently estimated at $438,943, approximately $214 per square foot. 2941 Oak Ridge Dr is a home located in Tarrant County with nearby schools including W.A. Porter Elementary School, Smithfield Middle School, and Birdville High School.
Ownership History
Date
Name
Owned For
Owner Type
Purchase Details
Closed on
Dec 21, 2016
Sold by
Ser Texas Llc
Bought by
Hpa Borrower 20162 Ml Llc
Current Estimated Value
Home Financials for this Owner
Home Financials are based on the most recent Mortgage that was taken out on this home.
Original Mortgage
$15,000,000
Outstanding Balance
$12,299,018
Interest Rate
4.03%
Mortgage Type
Commercial
Estimated Equity
-$11,860,075
Purchase Details
Closed on
Aug 26, 2013
Sold by
Covey James T
Bought by
Ser Texas Llc and Hyperion Homes Texas Llc
Purchase Details
Closed on
Aug 17, 2007
Sold by
Savoy Anthony R and Savoy Wendy
Bought by
Covey James T
Purchase Details
Closed on
Dec 19, 2000
Sold by
Denison Paul Wayne and Denison Michelle
Bought by
Savoy Anthony R and Savoy Timothy E
Home Financials for this Owner
Home Financials are based on the most recent Mortgage that was taken out on this home.
Original Mortgage
$140,600
Interest Rate
7.73%
Create a Home Valuation Report for This Property
The Home Valuation Report is an in-depth analysis detailing your home's value as well as a comparison with similar homes in the area
Home Values in the Area
Average Home Value in this Area
Purchase History
| Date | Buyer | Sale Price | Title Company |
|---|---|---|---|
| Hpa Borrower 20162 Ml Llc | -- | None Available | |
| Ser Texas Llc | -- | Stewart | |
| Covey James T | -- | None Available | |
| Savoy Anthony R | -- | -- |
Source: Public Records
Mortgage History
| Date | Status | Borrower | Loan Amount |
|---|---|---|---|
| Open | Hpa Borrower 20162 Ml Llc | $15,000,000 | |
| Previous Owner | Savoy Anthony R | $140,600 |
Source: Public Records
Tax History Compared to Growth
Tax History
| Year | Tax Paid | Tax Assessment Tax Assessment Total Assessment is a certain percentage of the fair market value that is determined by local assessors to be the total taxable value of land and additions on the property. | Land | Improvement |
|---|---|---|---|---|
| 2025 | $9,610 | $377,679 | $85,000 | $292,679 |
| 2024 | $9,610 | $423,000 | $85,000 | $338,000 |
| 2023 | $10,158 | $444,462 | $85,000 | $359,462 |
| 2022 | $9,082 | $367,316 | $50,000 | $317,316 |
| 2021 | $7,044 | $271,547 | $50,000 | $221,547 |
| 2020 | $6,978 | $271,547 | $50,000 | $221,547 |
| 2019 | $7,137 | $271,547 | $50,000 | $221,547 |
| 2018 | $5,946 | $226,222 | $50,000 | $176,222 |
| 2017 | $6,137 | $230,000 | $50,000 | $180,000 |
| 2016 | $5,718 | $214,269 | $35,000 | $179,269 |
| 2015 | $4,820 | $238,689 | $35,000 | $203,689 |
| 2014 | $4,820 | $179,700 | $20,000 | $159,700 |
Source: Public Records
Map
Nearby Homes
- 6801 Woodland Hills Dr
- 6708 Nob Hill Ct
- 6704 Nob Hill Ct
- 2908 Steve Dr
- 2829 Sandstone Dr
- 2809 Sandstone Dr
- 736 Springhill Dr
- 712 Springhill Dr
- 7020 Live Oak Dr
- 713 Paul Dr
- 2804 Ridgewood Dr
- 717 Reese Ln
- 2844 Hurstview Dr
- 6625 Crane Rd
- 6521 Rock Springs Dr
- 712 Springwood Dr
- 3229 David Dr
- 3132 Hurstview Dr
- 3233 David Dr
- 6505 Parkway Ave
- 2937 Oak Ridge Dr
- 3001 Oak Ridge Dr
- 2933 Oak Ridge Dr
- 3009 Oak Ridge Dr
- 2940 Oak Ridge Dr
- 2936 Oak Ridge Dr
- 3000 Oak Ridge Dr
- 2929 Oak Ridge Dr
- 2929 Oak Ridge Dr
- 9320 Western Ridge Trail
- 2932 Oak Ridge Dr
- 6820 Woodland Hills Dr
- 3013 Oak Ridge Dr
- 3008 Oak Ridge Dr
- 9316 Western Ridge Trail
- 2925 Oak Ridge Dr
- 2928 Oak Ridge Dr
- 6800 Switchback Trail
- 749 Ridgewood Cir
- 3012 Oak Ridge Dr